A billion Traversed Edges Per Second (a GTEPS) can be bought for around $0.26/hour via a powerful supercomputer, including hardware and energy costs only. We do not know if GTEPS can be bought more cheaply elsewhere.
We estimate that available TEPS/$ grows by a factor of ten every four years, based the relationship between TEPS and FLOPS. TEPS have not been measured enough to see long-term trends directly.
Background
Traversed edges per second (TEPS) is a measure of computer performance, similar to FLOPS or MIPS. Relative to these other metrics, TEPS emphasizes the communication capabilities of machines: the ability to move data around inside the computer. Communication is especially important in very large machines, such as supercomputers, so TEPS is particularly useful in evaluating these machines.
The Graph 500 is a list of computers which have been evaluated according to this metric. It is intended to complement the Top 500, which is a list of the most powerful 500 computers, measured in FLOPS. The Graph 500 began in 2010, and so far has measured 183 machines, though many of these are not supercomputers, and would presumably not rank among the best 500 TEPS scores if more supercomputers computers were measured.
The TEPS benchmark is defined as the number of graph edges traversed per second during a breadth-first search of a very large graph. The scale of the graph is tuned to grow with the size of the hardware. See the Graph500 benchmarks page for further details.
The brain in TEPS
We are interested in TEPS in part because we would like to estimate the brain’s capacity in terms of TEPS, as an input to forecasting AI timelines. One virtue of this is that it will be a relatively independent measure of how much hardware the human brain is equivalent to, which we can then compare to other estimates. It is also easier to measure information transfer in the brain than computation, making this a more accurate estimate. We also expect that at the scale of the brain, communication is a significant bottleneck (much as it is for a supercomputer), making TEPS a particularly relevant benchmark. The brain’s contents support this theory: much of its mass and energy appears to be used on moving information around.
Current TEPS available per dollar
We estimate that a TEPS can currently be produced for around $0.26 per hour in a supercomputer.
Our estimate
Table 1 shows our calculation, and sources for price figures.
We recorded the TEPS scores for the top eight computers in the Graph 500 (i.e. the best TEPS-producing computers known). We searched for price estimates for these computers, and found five of them. We assume these prices are for hardware alone, though this was not generally specified. The prices are generally from second-hand sources, and so we doubt they are particularly reliable.
Energy costs
We took energy use figures for the five remaining computers from the Top 500 list. Energy use on the Graph 500 and Top 500 benchmarks are probably somewhat different, especially because computers are often scaled down for the Graph 500 benchmark. See ‘Bias from scaling down’ below for discussion of this problem. There is a Green Graph 500 list, which gives energy figures for some of the supercomputers doing similar problems to those in the Graph 500, but the computers are run at different scales there to in the Graph 500 (presumably to get better energy ratings), so the energy figures given there are also not directly applicable.
The cost of electricity varies by location. We are interested in how cheaply one can produce TEPS, so we suppose computation is located somewhere where power is cheap, charged at industrial rates. Prevailing energy prices in the US are around $0.20 / kilowatt hour, but in some parts of Canada it seems industrial users pay less than $0.05 / kilowatt hour. This is also low relative to industrial energy prices in various European nations (though these nations too may have small localities with cheaper power). Thus we take $0.05 to be a cheap but feasible price for energy.
Bias from scaling down
Note that our method likely overestimates necessary hardware and energy costs, as many computers do not use all of their cores in the Graph 500 benchmark (this can be verified by comparing to cores used in the Top 500 list compiled at the same time). This means that one could get better TEPS/$ prices by just not building parts of existing computers. It also means that the energy used in the Graph 500 benchmarking (not listed) was probably less than that used in the Top 500 benchmarking.
We correct for this by scaling down prices according to cores used. This is probably not a perfect adjustment: the costs of building and running a supercomputer are unlikely to be linear in the number of cores it has. However this seems a reasonable approximation, and better than making no adjustment.
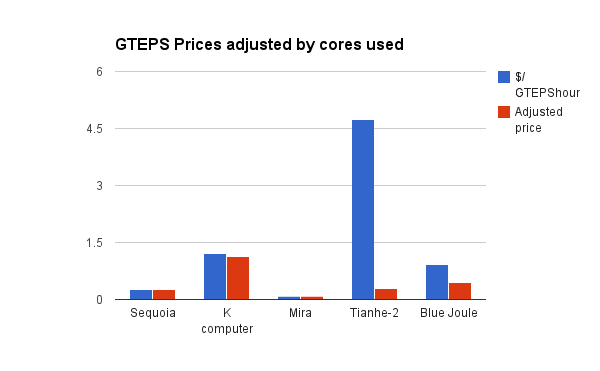
This change makes the data more consistent. The apparently more expensive sources of TEPS were using smaller fractions of their cores (if we assume they used all cores in the Graph 500), and the very expensive Tianhe-2 was using only 6% of its cores. Scaled according to the fraction of cores used in Graph 500, Tianhe-2 produces TEPShours at a similar price to Sequoia. The two apparently cheapest sources of TEPShours (Sequoia and Mira) appear to have been using all of their cores. Figure 1 shows the costs of TEPShours on the different supercomputers, next to the costs when scaled down according to the fraction of cores that were used in the Graph 500 benchmark.
Other costs
Supercomputers have many costs besides hardware and energy, such as property, staff and software. Figures for these are hard to find. This presentation suggests the total cost of a large supercomputerover several years can be more than five times the upfront hardware cost. However these figures seem surprisingly high, and we suspect they are not applicable to the problem we are interested in: running AI. High property costs are probably because supercomputers tend to be built in college campuses. Strong AI software is presumably more expensive than what is presently bought, but we do not want to price this into the estimate. Because the figures in the presentation are the only ones we have found, and appear to be inaccurate, we will not further investigate the more inclusive costs of producing TEPShours here, and focus on upfront hardware costs and ongoing energy costs.
Supercomputer lifespans
We assume a supercomputer lasts for five years. This was the age of Roadrunner when decommissioned in 2013, and is consistent with the ages of the computers whose prices we are calculating here — they were all built between 2011 and 2013. ASCI Red lasted for nine years, but was apparently considered ‘supercomputing’s high-water mark in longevity‘. We did not find other examples of large decommissioned supercomputers with known lifespans.
Calculation
From all of this, we calculate the price of a GTEPShour in each of these systems, as shown in table 1.
| Name | GTeps | Estimated Price (million) | Hardware cost/hour (5 year life) | Energy (kW) | Hourly energy cost (at 5c/kWh) | Total $/hour (including hardware and energy) |
$/GTEPShours (including hardware and energy) |
$/GTEPShours scaled by cores used | Cost sources |
| DOE/NNSA/LLNL Sequoia (IBM – BlueGene/Q, Power BQC 16C 1.60 GHz) | 23751 | $250 | $5,704 | 7,890.00 | $394.50 | 6,098.36 | $0.26 | $0.26 | 1 |
| K computer (Fujitsu – Custom supercomputer) | 19585.2 | $1,000 | $22,815 | 12,659.89 | $632.99 | 23,448.42 | $1.20 | $1.13 | 2 |
| DOE/SC/Argonne National Laboratory Mira (IBM – BlueGene/Q, Power BQC 16C 1.60 GHz) | 14982 | $50 | $1,141 | 3,945.00 | $197.25 | 1,338.02 | $0.09 | $0.09 | 3 |
| Tianhe-2 (MilkyWay-2) (National University of Defense Technology – MPP) | 2061.48 | $390 | $8,898 | 17,808.00 | $890.40 | 9,788.42 | $4.75 | $0.30 | 4 |
| Blue Joule (IBM – BlueGene/Q, Power BQC 16C 1.60 GHz) | 1427 | $55.3 | $1,262 | 657.00 | $32.85 | 1,294.54 | $0.91 | $0.46 | 5 |
Table 1: Calculation of costs of a TEPS over one hour in five supercomputers.
Sequoia as representative of cheap TEPShours
Mira and then Sequoia produce the cheapest TEPShours of the supercomputers investigated here, and are also the only ones which used all of their cores in the benchmark, making their costs less ambiguous. Mira’s costs are ambiguous nonetheless, because the $50M price estimate we have was projected by an unknown source, ahead of time. Mira is also known to have been bought using some part of a $180M grant. If Mira cost most of that, it would be more expensive than Sequoia. Sequoia’s price was given by the laboratory that bought it, after the fact, so is more likely to be reliable.
Thus while Sequoia does not appear to be the cheapest source of TEPS, it does appear to be the second cheapest, and its estimate seems substantially more reliable. Sequoia is also a likely candidate to be especially cheap, since it is ranked first in the Graph 500, and is the largest of the IBM Blue Gene/Qs, which dominate the top of the Graph 500 list. This somewhat supports the validity of its apparent good price performance here.
Sequoia is also not much cheaper than the more expensive supercomputers in our list, once they are scaled down according to the number of cores they used on the benchmark (see Table 1), further supporting this price estimate.
Thus we estimate that GTEPShours can be produced for around $0.26 on current supercomputers. This corresponds to around $11,000/GTEP to buy the hardware alone.
Price of TEPShours in lower performance computing
We have only looked at the price of TEPS in top supercomputers. While these produce the most TEPS, they might not be the part of the range which produces TEPS most cheaply. However because we are interested in the application to AI, and thus to systems roughly as large as the brain, price performance near the top of the range is particularly relevant to us. Even if a laptop could produce a TEPS more cheaply than Sequoia, it produces too few of them to run a brain efficiently. Nonetheless, we plan to investigate TEPS/$ in lower performing computers in future.
For now, we checked the efficiency of an iPad 3, since one was listed near the bottom of the Graph 500. These are sold for $349.99, and apparently produce 0.0304 GTEPS. Over five years, this comes out at exactly the same price as the Sequoia: $0.26/GTEPShour. This suggests both that cheaper computers may be more efficient than large supercomputers (the iPad is not known for its cheap computing power) and that the differences in price are probably not large across the performance spectrum.
Trends in TEPS available per dollar
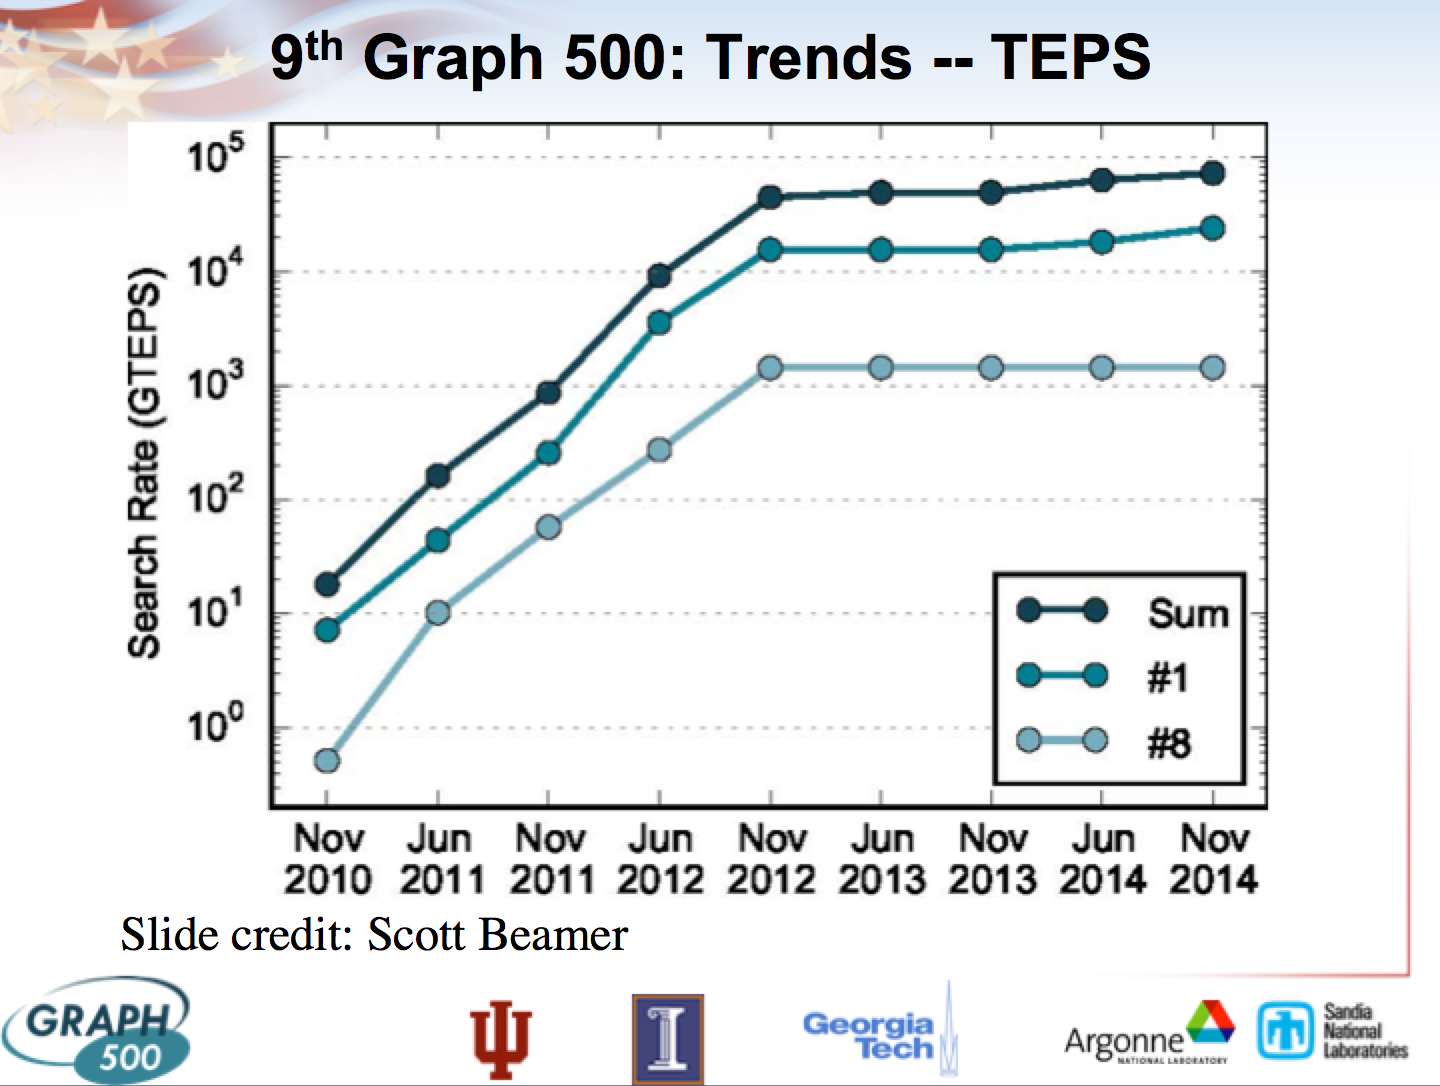
The long-term trend of TEPS is not well known, as the benchmark is new. This makes it hard to calculate a TEPS/$ trend. Figure 2 is from a powerpoint Announcing the 9th Graph500 List! from the Top 500 website. One thing it shows is top performance in the Graph 500 list since the list began in 2010. Top performance grew very fast (3.5 orders of magnitude in two years), before completely flattening, then growing slowly. The powerpoint attributes this pattern to ‘maturation of the benchmark’, suggesting that the steep slope was probably not reflective of real progress.
One reason to expect this pattern is that during the period of fast growth, pre-existing high performance computers were being tested for the first time. This appears to account for some of it. However we note that in June 2012, Sequoia (which tops the list at present) and Mira (#3) had both already been tested, and merely had lower performance than they do now, suggesting at least one other factor is at play. One possibility is that in the early years of using the benchmark, people develop good software for the problem, or in other ways adjust how they use particular computers on the benchmark.
Relationship between TEPS and FLOPS
The top eight computers in the Graph 500 are also in the Top 500, so we can compare their TEPS and FLOPS ratings. Because many computers did not use all of their cores in the Graph 500, we scale down the FLOPS measured in the Top 500 by the fraction of cores used in the Graph 500 relative to the Top 500 (this is discussed further in ‘Bias from scaling down’ above). We have not checked thoroughly whether FLOPS scales linearly with cores, but this appears to be a reasonable approximation, based on the first page of the Top 500 list.
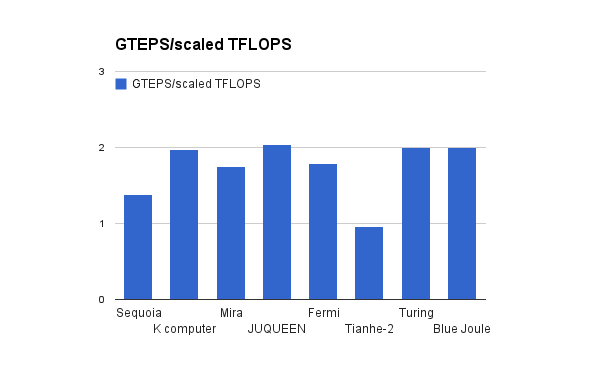
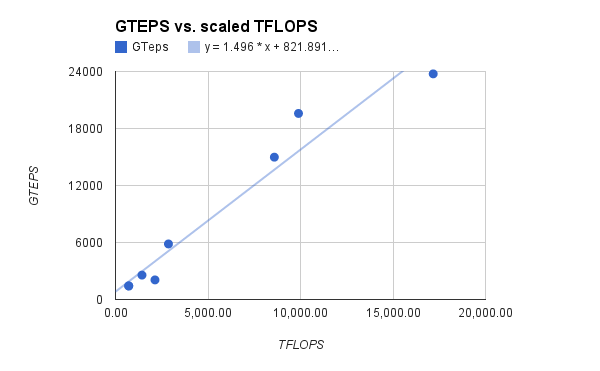
The supercomputers measured here consistently achieve around 1-2 GTEPS per scaled TFLOPS (see Figure 3). The median ratio is 1.9 GTEPS/TFLOP, the mean is 1.7 GTEPS/TFLOP, and the variance 0.14 GTEPS/TFLOP. Figure 4 shows GTEPS and TFLOPS plotted against one another.
The ratio of GTEPS to TFLOPS may vary across the range of computing power. Our figures may may also be slightly biased by selecting machines from the top of the Graph 500 to check against the Top 500. However the current comparison gives us a rough sense, and the figures are consistent.
This presentation (slide 23) reports that a Kepler GPU produces 109 TEPS, as compared to 1012 FLOPS reported here (assuming that both are top end models), suggesting a similar ratio holds for less powerful computers.
Projecting TEPS based on FLOPS
Since the conversion rate between FLOPS and TEPS is approximately consistent, we can project growth in TEPS/$ based on the better understood growth of FLOPS/$. In the last quarter of a century, FLOPS/$ has grown by a factor of ten roughly every four years. This suggests that TEPS/$ also grows by a factor of ten every four years.
- “Livermore told us it spent roughly $250 million on Sequoia.” http://arstechnica.com/information-technology/2012/06/with-16-petaflops-and-1-6m-cores-doe-supercomputer-is-worlds-fastest/
- “The K Computer in Japan, for example, cost more than $1 billion to build and $10 million to operate each year.” http://arstechnica.com/information-technology/2012/06/with-16-petaflops-and-1-6m-cores-doe-supercomputer-is-worlds-fastest/ (note that our estimated energy expenses come to around $5M, which seems consistent with this).
- “Mira is expected to cost roughly $50 million, according to reports.” https://www.alcf.anl.gov/articles/mira-worlds-fastest-supercomputer”IBM did not reveal the price for Mira, though it did say Argonne had purchased it with funds from a US$180 million grant.” http://www.pcworld.com/article/218951/us_commissions_beefy_ibm_supercomputer.html,
- “Cost: 2.4 billion Yuan or 3 billion Hong Kong dollars (390 million US Dollars)” http://www.crizmo.com/worlds-top-10-supercomputers-with-their-cost-speed-and-usage.html
- “Blue Joule…The cost of this system appears to be 10 times (£37.5 million) the above mentioned grant to develop the Emerald GPU supercomputer.” http://hexus.net/business/news/enterprise/41937-uks-powerful-gpu-supercomputer-booted/ Note that £37.5M = $55.3M

2 Trackbacks / Pingbacks