By Katja Grace, 13 April 2020
I. The search for discontinuities
We’ve been looking for historic cases of discontinuously fast technological progress, to help with reasoning about the likelihood and consequences of abrupt progress in AI capabilities. We recently finished expanding this investigation to 37 technological trends.1 This blog post is a quick update on our findings. See the main page on the research and its outgoing links for more details.
We found ten events in history that abruptly and clearly contributed more to progress on some technological metric than another century would have seen on the previous trend.2 Or as we say, we found ten events that produced ‘large’, ‘robust’ ‘discontinuities’.

Another five events caused robust discontinuities of between ten and a hundred years (‘moderate robust discontinuities’). And 48 more events caused some trend to depart from our best guess linear or exponential extrapolation of its past progress by at least ten years (and often a hundred), but did so in the context of such unclear past trends that this did not seem clearly remarkable.3 I call all of these departures ‘discontinuities’, and distinguish those that are clearly outside plausible extrapolations of the past trend, according to my judgment, as ‘robust discontinuities’.4
Much of the data involved in this project seems at least somewhat unreliable, and the methods involve many judgments, and much ignoring of minor issues. So I would not be surprised if more effort could produce numerous small changes. However I expect the broad outlines to be correct.5
II. The discontinuities
Large robust discontinuities
Here is a quick list of the robust 100-year discontinuous events, which I’ll describe in more detail beneath:
- The Pyramid of Djoser, 2650BC (discontinuity in structure height trends)
- The SS Great Eastern, 1858 (discontinuity in ship size trends)
- The first telegraph, 1858 (discontinuity in speed of sending a 140 character message across the Atlantic Ocean)
- The second telegraph, 1866 (discontinuity in speed of sending a 140 character message across the Atlantic Ocean)
- The Paris Gun, 1918 (discontinuity in altitude reached by man-made means)
- The first non-stop transatlantic flight, in a modified WWI bomber, 1919 (discontinuity in both speed of passenger travel across the Atlantic Ocean and speed of military payload travel across the Atlantic Ocean)
- The George Washington Bridge, 1931 (discontinuity in longest bridge span)
- The first nuclear weapons, 1945 (discontinuity in relative effectiveness of explosives)
- The first ICBM, 1958 (discontinuity in average speed of military payload crossing the Atlantic Ocean)
- YBa2Cu3O7 as a superconductor, 1987 (discontinuity in warmest temperature of superconduction)
The Pyramid of Djoser, 2650BC
Discontinuity in structure height trends6
The Pyramid of Djoser is considered to be ‘the earliest colossal stone structure’ in Egypt. According to Wikipedia’s data, it took seven thousand years for the tallest structures to go from five to thirteen meters tall7 and then suddenly the Egyptian pyramids shot up to a height of 146.5m over about a hundred years and five successively tallest pyramids.

The first of these five is the Pyramid of Djoser, standing 62.5m tall. The second one—Meidum Pyramid—is also a large discontinuity in structure height trends by our calculation, but I judge it not robust, since it is fairly unclear what the continuation of the trend should be after the first discontinuity. As is common, the more basic thing going on seems to be a change in the growth rate, and the discontinuity of the Pyramid of Djoser is just the start of it.

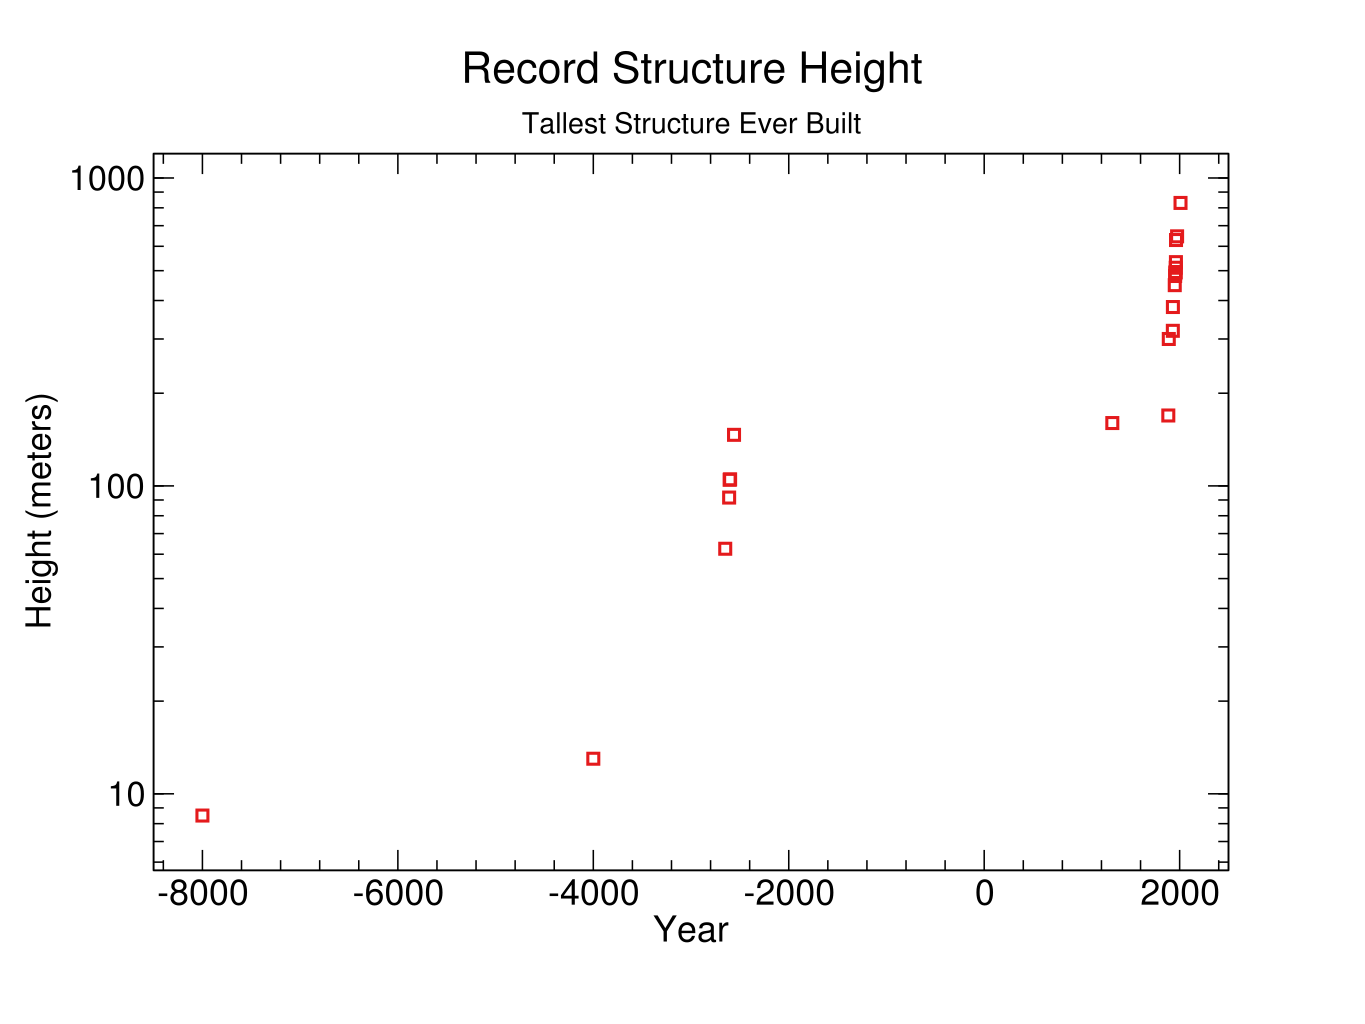
Strangely, after this spurt of progress, humanity built nothing taller than the tallest pyramid for nearly four thousand years—until Lincoln Cathedral in 1311—and nothing more than twenty percent taller than it until the Eiffel Tower in 1889.
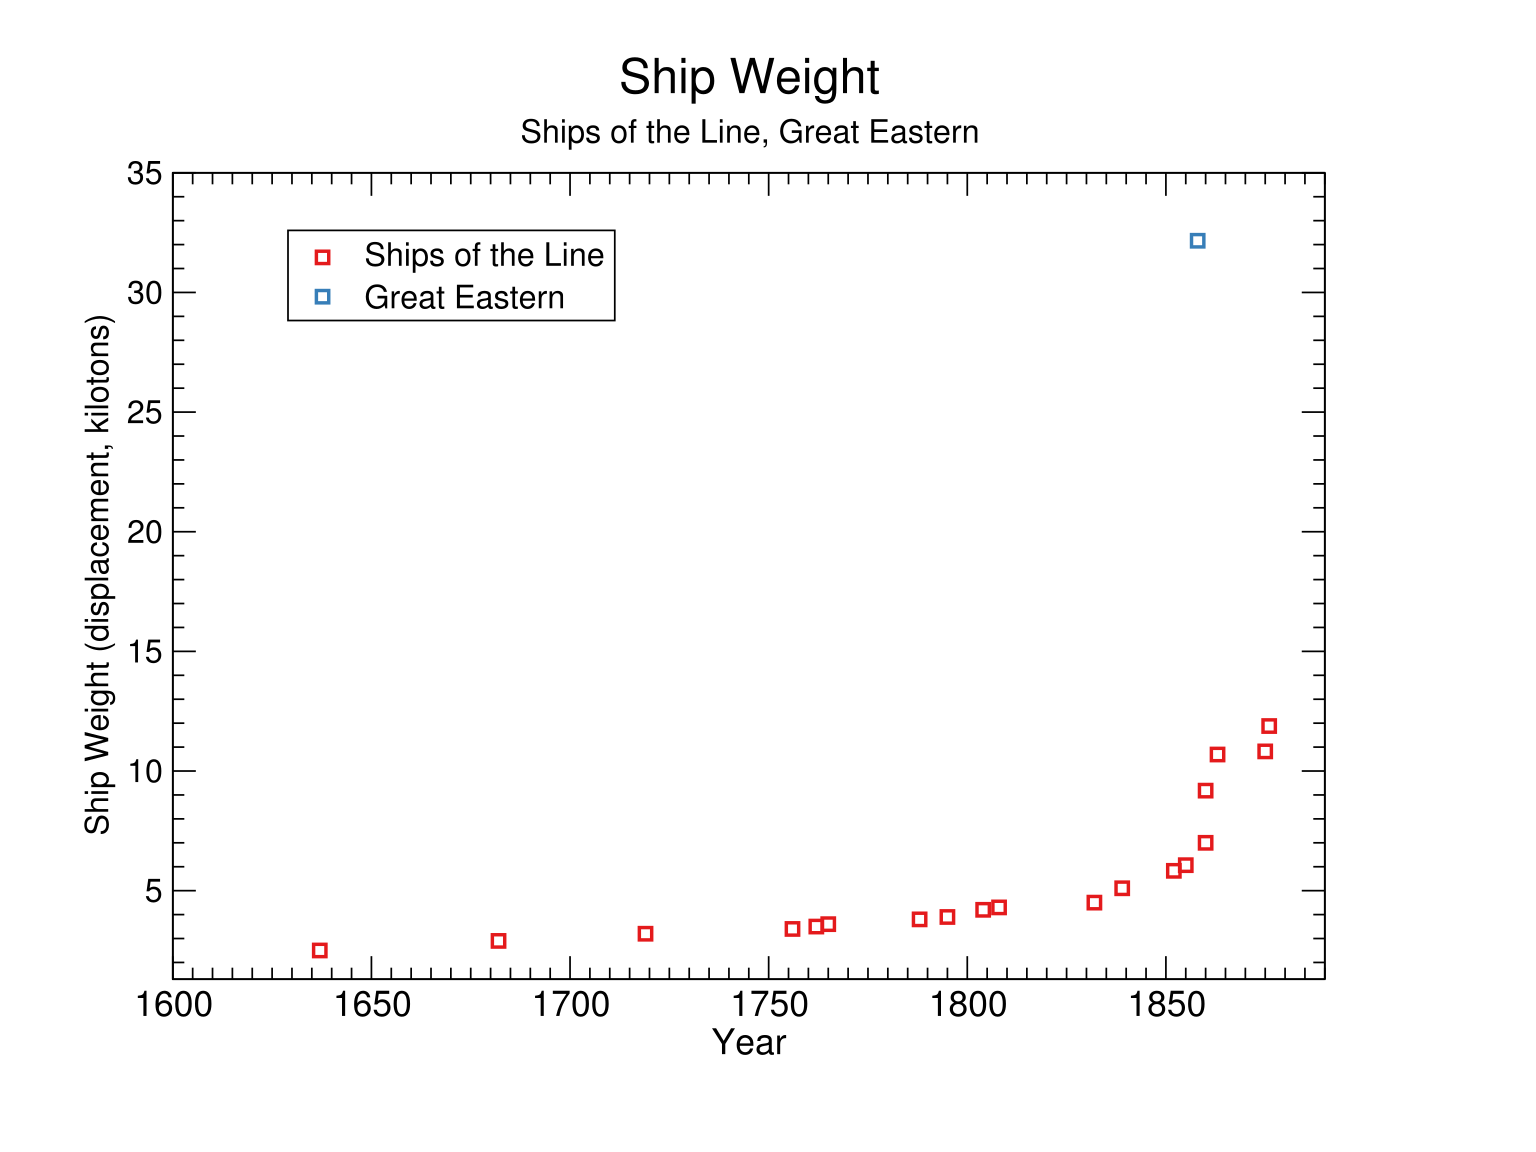
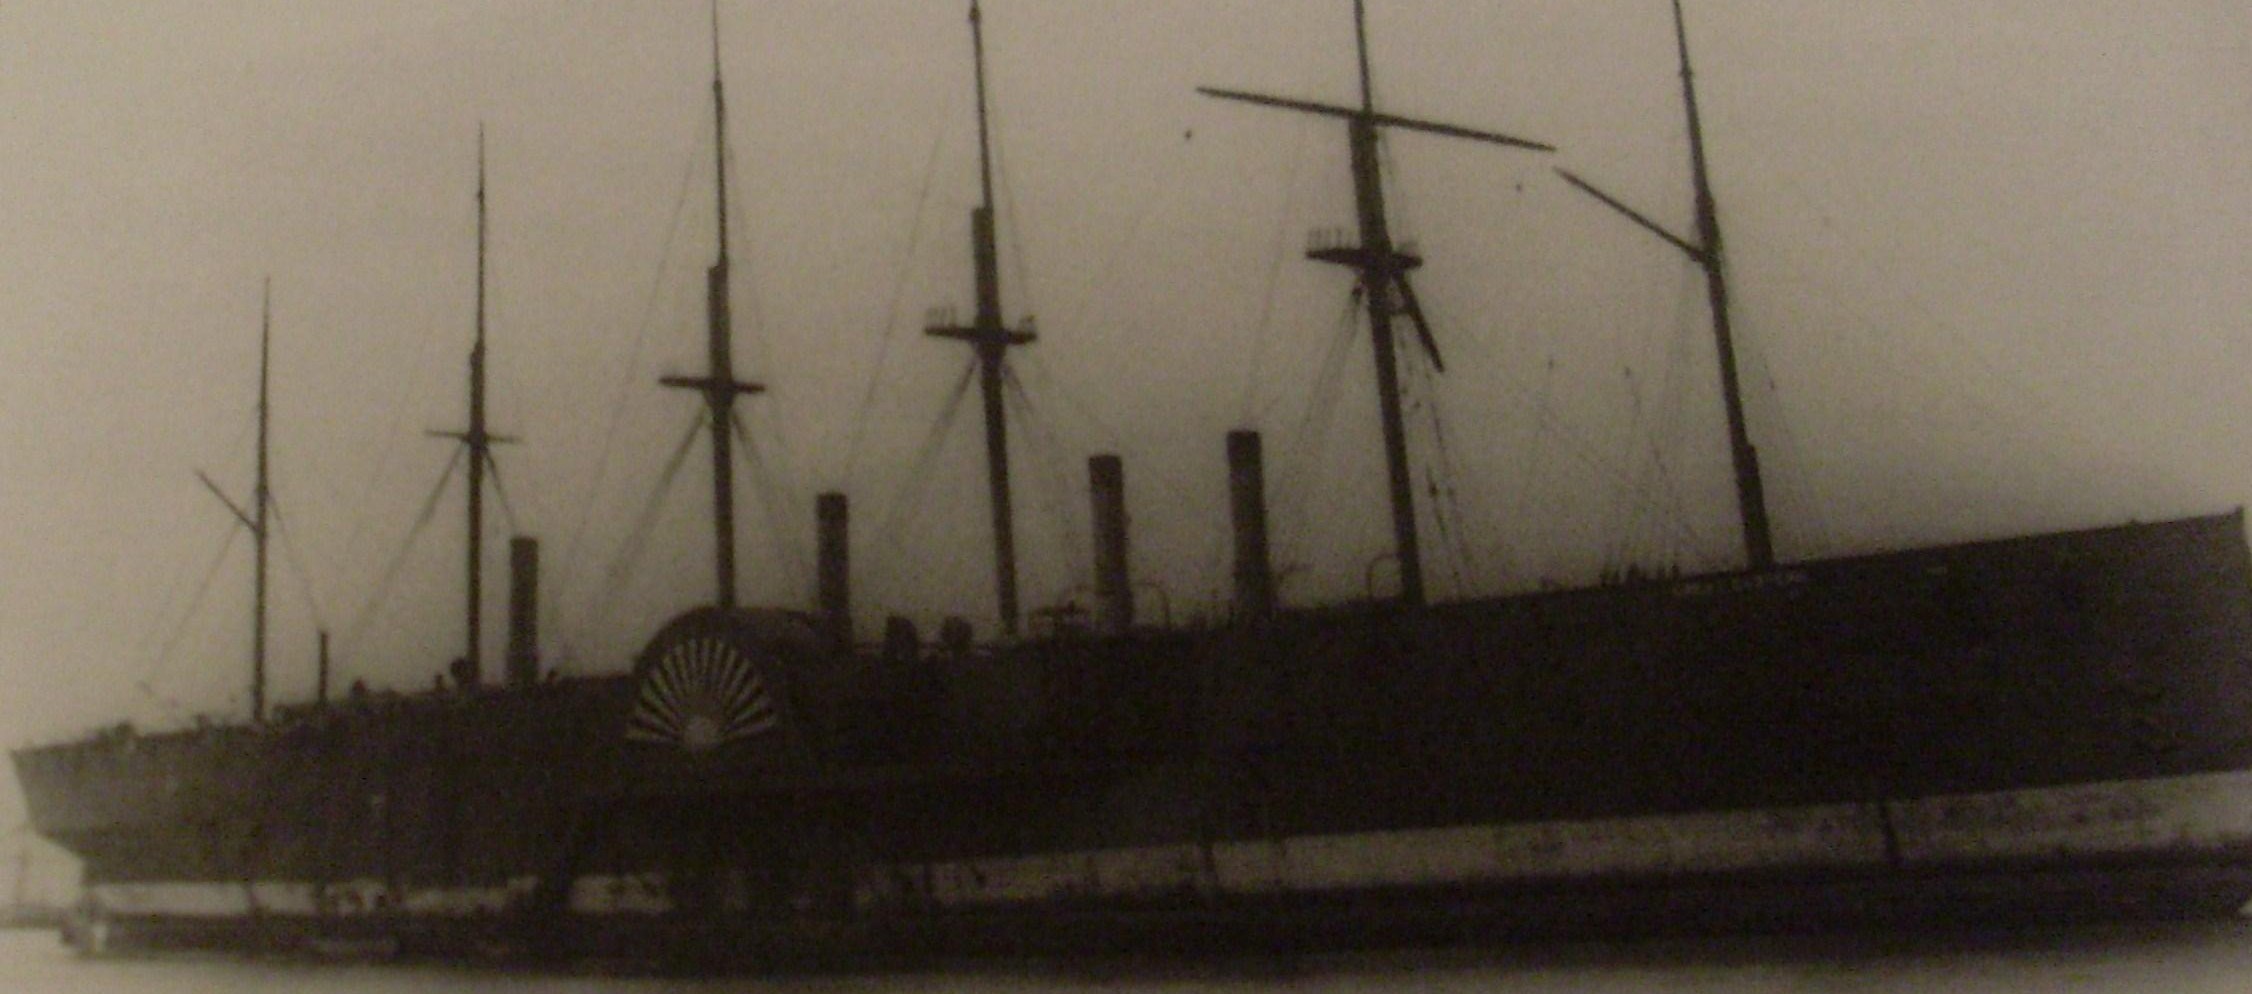
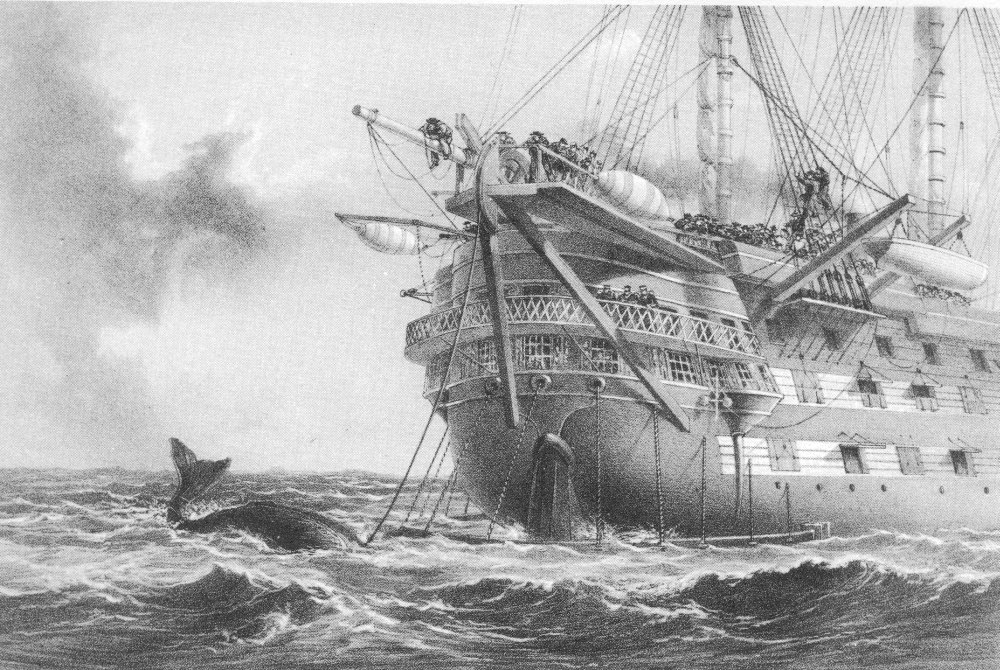
The SS Great Eastern
Discontinuity in ship size, measured in ‘builder’s old measurement’8 or in displacement.
The SS Great Eastern was a freakishly large ship. For instance, it seems to have weighed about five times as much as any previous ship. As far as I can tell, the reason it existed is that Isambard Kingdom Brunell thought it would be good. Brunell was a 19th Century engineering hero, rated #2 greatest Briton of all time in a 2002 BBC poll, who according to Wikipedia, ‘revolutionised public transport and modern engineering’ and built ‘dockyards, the Great Western Railway (GWR), a series of steamships including the first propeller-driven transatlantic steamship, and numerous important bridges and tunnels’.
The experimental giant sailing steamship idea doesn’t seem to have gone well. The Great Eastern apparently never had its cargo holds filled, and ran at a deficit for years before being sold and used for laying the second telegraph cable (another source of large discontinuity—see below).9 It was designed for transporting passengers to the Far East, but there was never the demand.10 It was purportedly rumored to be ‘cursed’, and suffered various ill fortune. On its maiden voyage a boiler exploded, throwing one of the funnels into the air and killing six people.11 Later it hit a rock and got a 9-foot gash, which seems to have been hard to fix because the ship was too big for standard repair methods.12
We don’t have a whole trend for largest ships, so are using British Royal Navy ship of the line size trends as a proxy against which to compare the Great Eastern.13 This gives us discontinuities of around 400 years in both displacement and tonnage (BOM). [Added May 10: Nuño Sempere also investigated the Great Eastern as a discontinuity, and has some nice figures comparing it to passenger and sailing vessel trends.]
However that is assuming we expect ship size to increase either linearly or exponentially (our usual expectation). But looking at the ship of the line trends, both displacement and cargo capacity (measured in tonnage, BOM) seemed to grow at something closer to a hyperbolic curve for some reason—apparently accelerating toward an asymptote in the late 1860s. If we had expected progress to continue this way throughout, then neither trend had any discontinuities, instead of eight or eleven of them. And supposing that overall ship size follows the same hyperbola as the military ship trends, then the Great Eastern’s discontinuities go from around 400 years to roughly 11 or 13 years. Which doesn’t sound big, but since this was about that many years before of the asymptote of the hyperbola at which point arbitrarily large ships were theoretically expected, the discontinuities couldn’t have been much bigger.
Our data ended for some reason just around the apparently impending ship size singularity of the late 1860s. But my impression is that not much happened for a while—it apparently took forty years for a ship larger than the Great Eastern to be built, on many measures.
I am unsure what to make of the apparently erroneous and unforced investment in the most absurdly enormous ship happening within a decade or two of the point at which trend extrapolation appears to have suggested arbitrarily large ships. Was Brunell aware of the trend? Did the forces that produced the rest of the trend likewise try to send all the players in the ship-construction economy up the asymptote, where they crashed into some yet unmet constraint? It is at least nice to have more examples of what happens when singularities are reached in the human world.
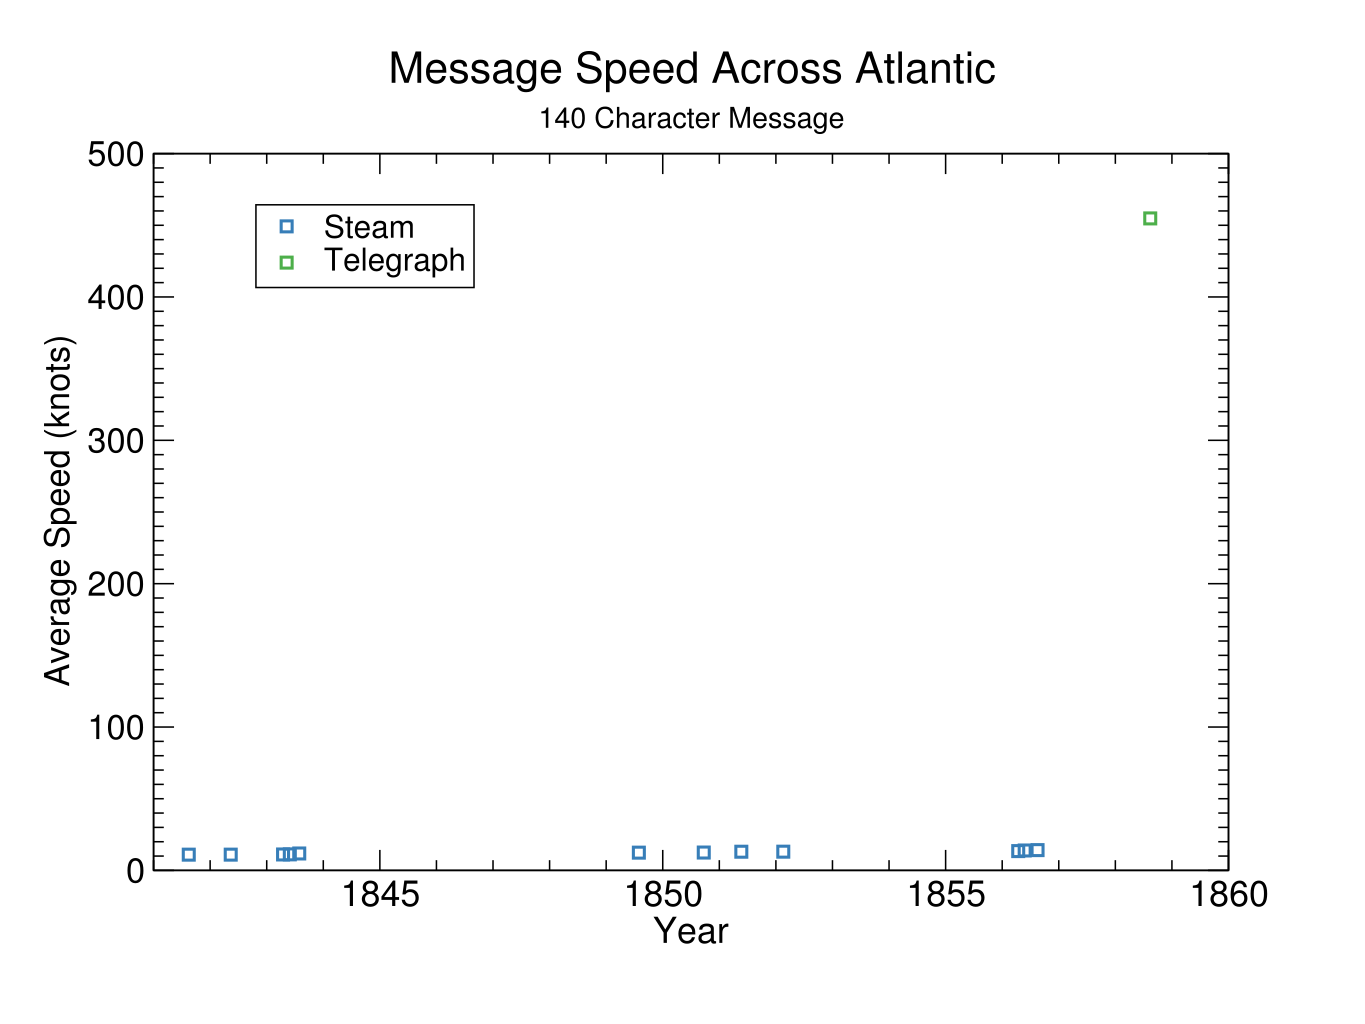
The first transatlantic telegraph
Discontinuity in speed of sending a 140 character message across the Atlantic Ocean
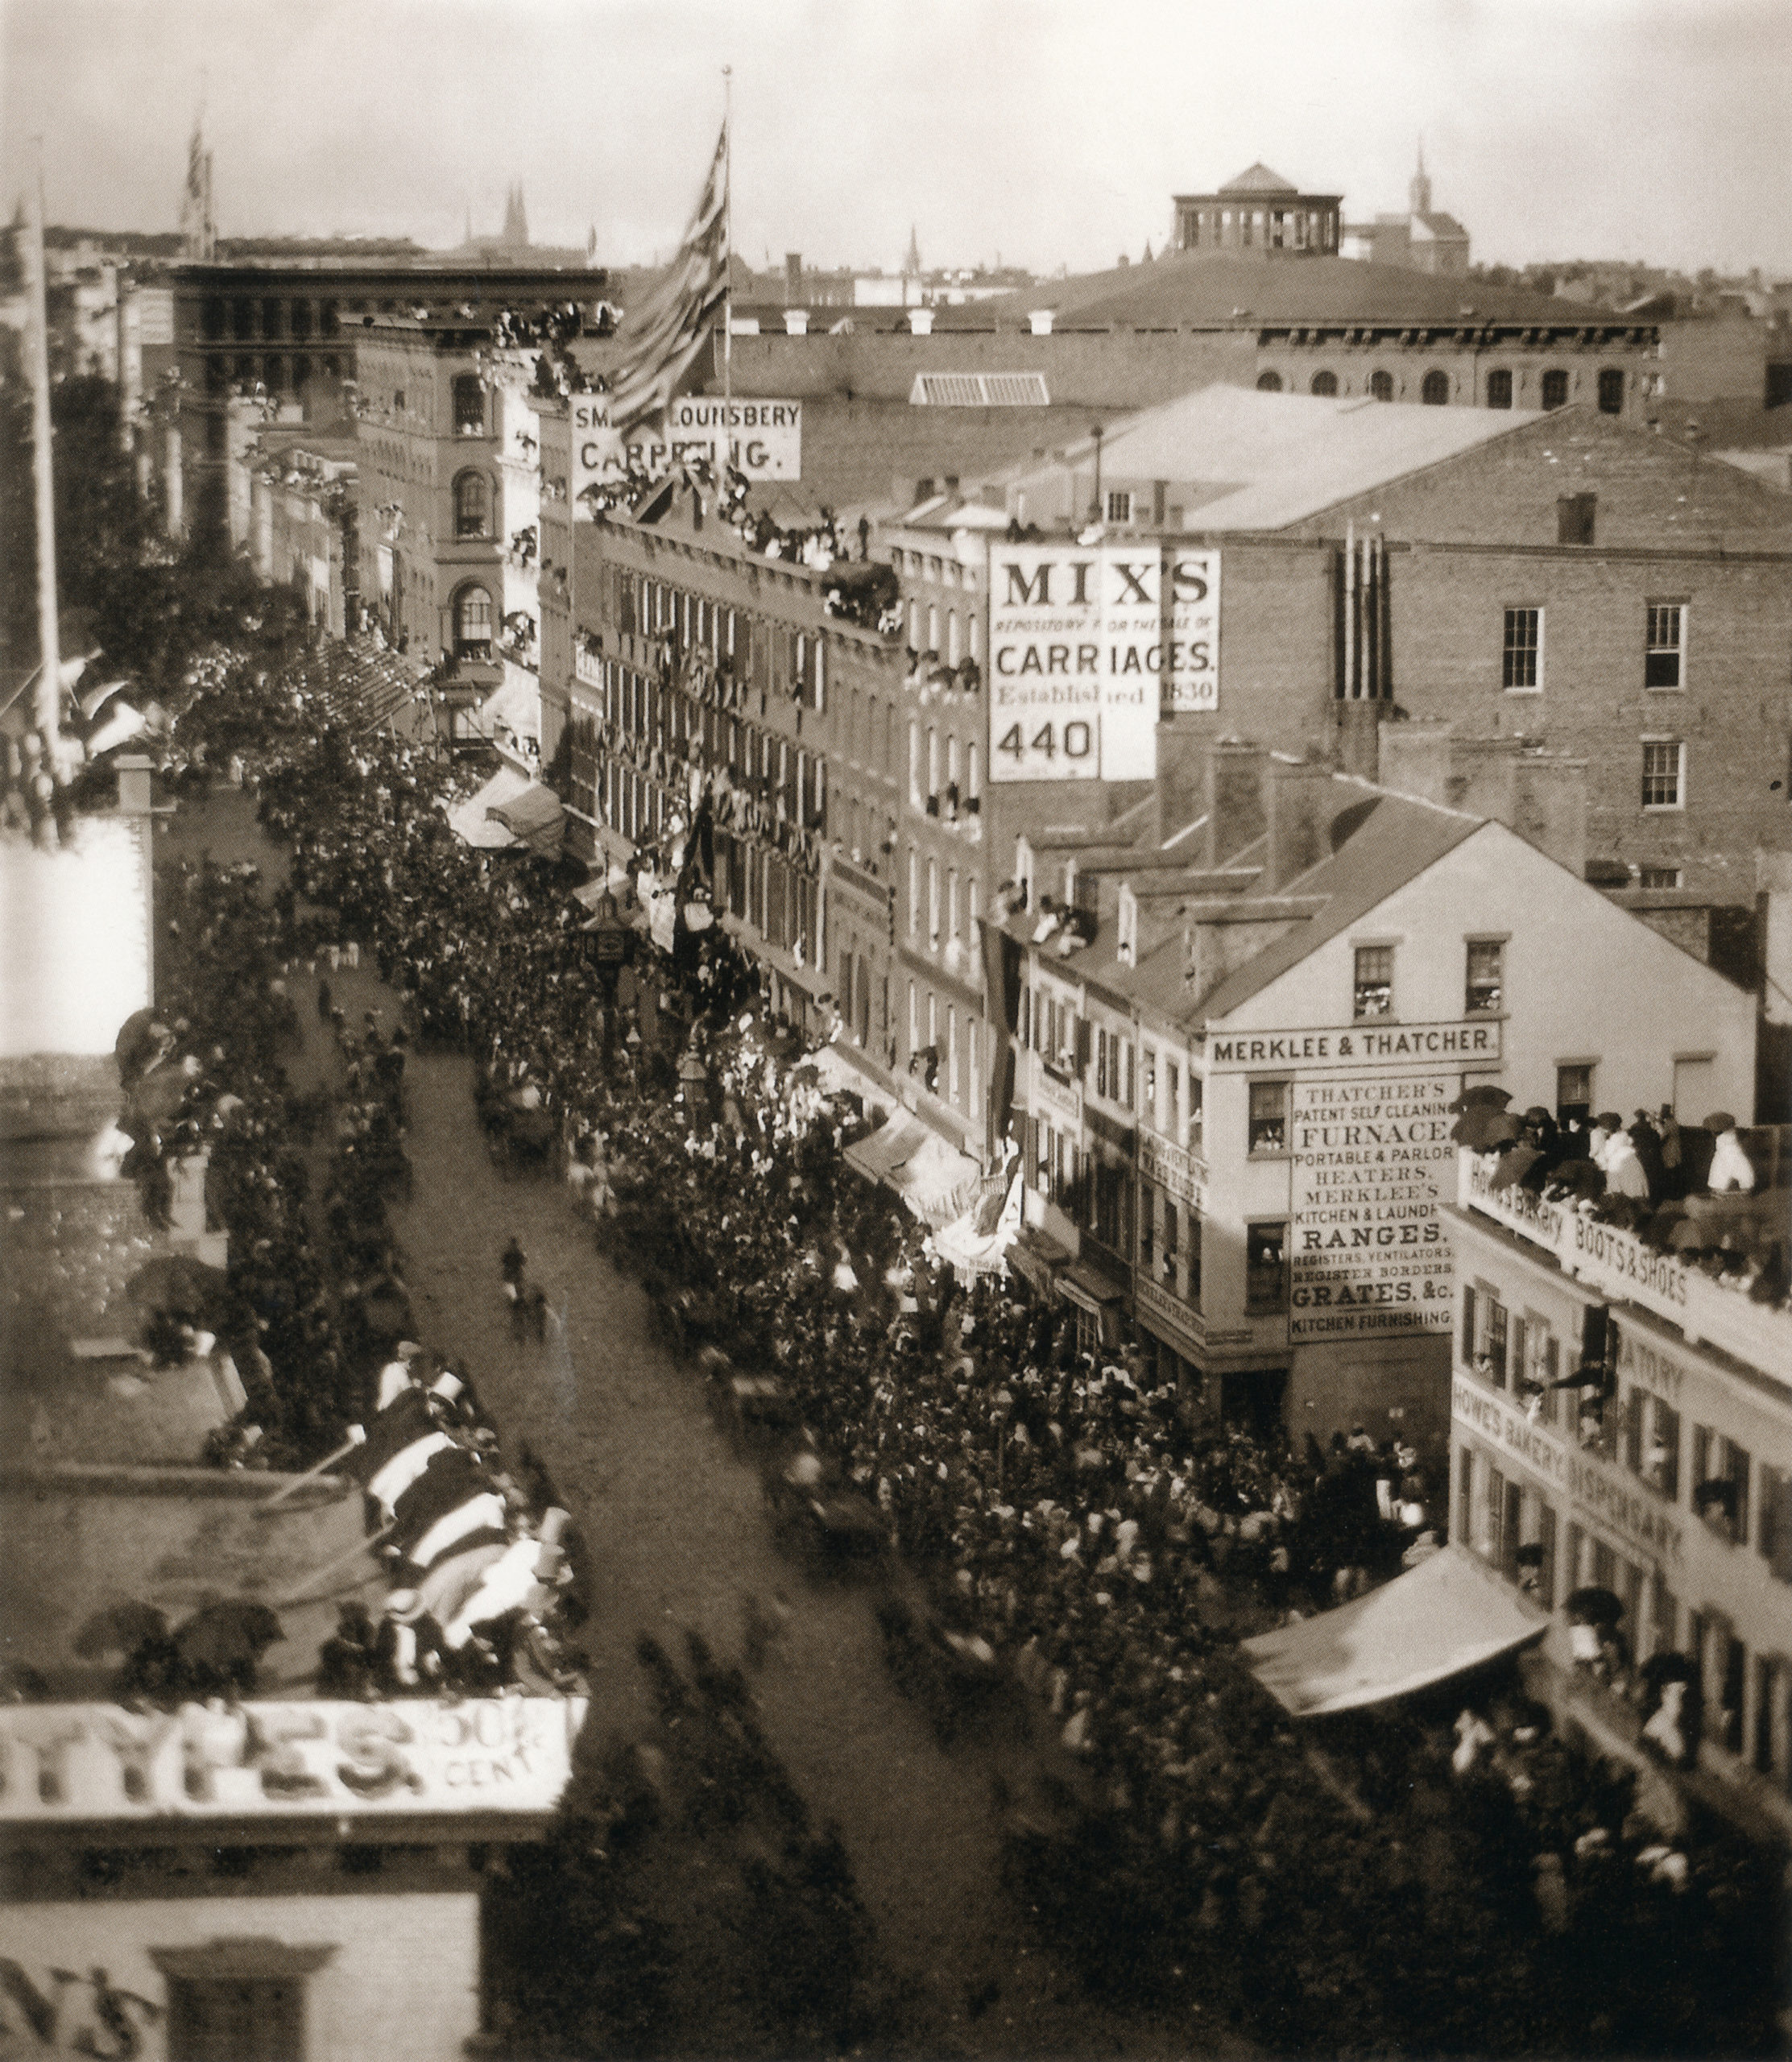
Until 1858, the fastest way to get a message from New York to London was by ship, and the fastest ships took over a week14. Telegraph was used earlier on land, but running it between continents was quite an undertaking. The effort to lay the a transatlantic cable failed numerous times before it became ongoingly functional.15 One of those times though, it worked for about a month, and messages were sent.16 There were celebrations in the streets.
The telegraph could send a 98 word message in a mere 16 hours. For a message of more than about 1400 words, it would actually have been faster to send it by ship (supposing you already had it written down). So this was a big discontinuity for short messages, but not necessarily any progress at all for longer ones.
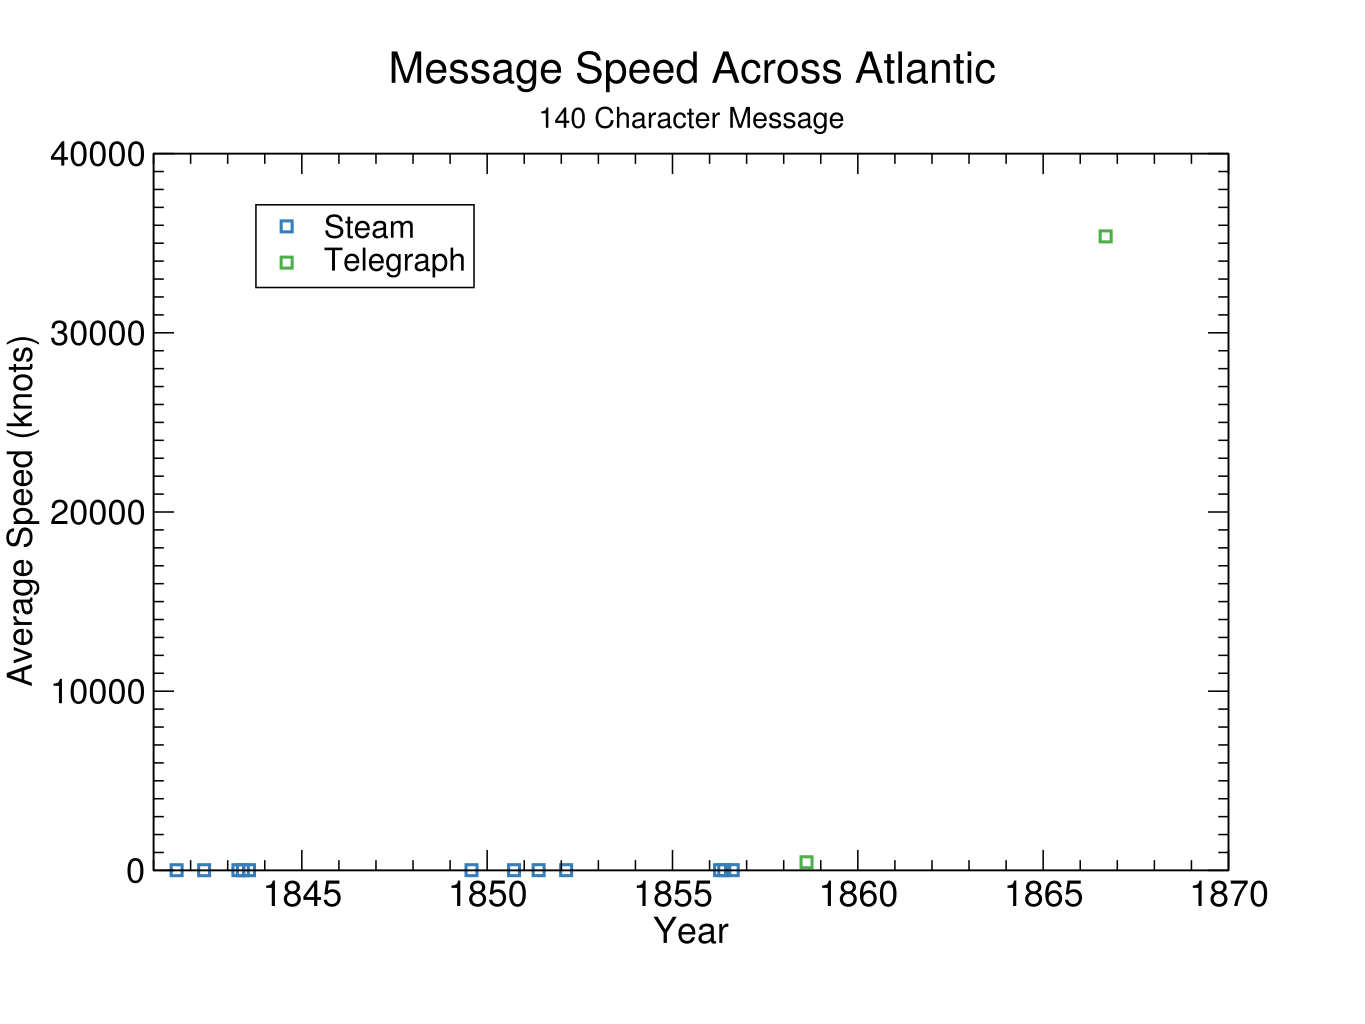
The second transatlantic telegraph
Discontinuity in speed of sending a 140 character message across the Atlantic Ocean
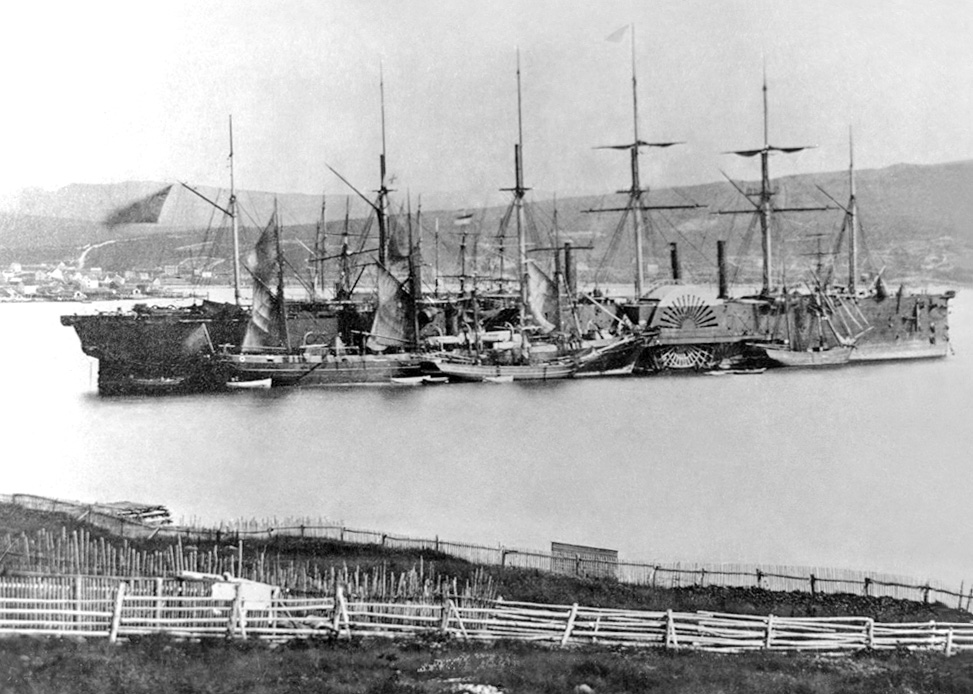
After the first working transatlantic telegraph cable (see above) failed in 1858, it was another eight years before the second working cable was finished. Most of that delay was apparently for lack of support.17 and the final year seems to have been because the cable broke and the end was lost at sea after over a thousand miles had been laid, leaving the ship to return home and a new company to be established before the next try.18 Whereas it sounds like it took less than a day to go from the ship carrying the cable arriving in port, and the sending of telegraphs.
At a glance, on Wikipedia’s telling, it sounds as though the perseverance of one person—Cyrus West Field—might have affected when fast transatlantic communication appeared by years. He seems to have led all five efforts, supplied substantial money himself, and ongoingly fundraised and formed new companies, even amidst a broader lack of enthusiasm after initial failures. (He was also given a congressional gold medal for establishing the transatlantic telegraph cable, suggesting the US congress also has this impression.) His actions wouldn’t have affected how much of a discontinuity either telegraph was by much, but it is interesting if such a large development in a seemingly important area might have been accelerated much by a single person.
The second telegraph cable was laid by the Great Eastern, the discontinuously large ship of two sections ago. Is there some reason for these two big discontinuities to be connected? For instance, did one somehow cause the other? That doesn’t seem plausible. The main way I can think of that the transatlantic telegraph could have caused the Great Eastern‘s size would be if the economic benefits of being able to lay cable were anticipated and effectively subsidized the ship. I haven’t heard of this being an intended use for the Great Eastern. And given that the first transatlantic telegraph was not laid by the Great Eastern, it seems unlikely that such a massive ship was strictly needed for the success of a second one at around that time, though the second cable used was apparently around twice as heavy as the first. Another possibility is that some other common factor made large discontinuities more possible. For instance, perhaps it was an unusually feasible time and place for solitary technological dreamers to carry out ambitious and economically adventurous projects.
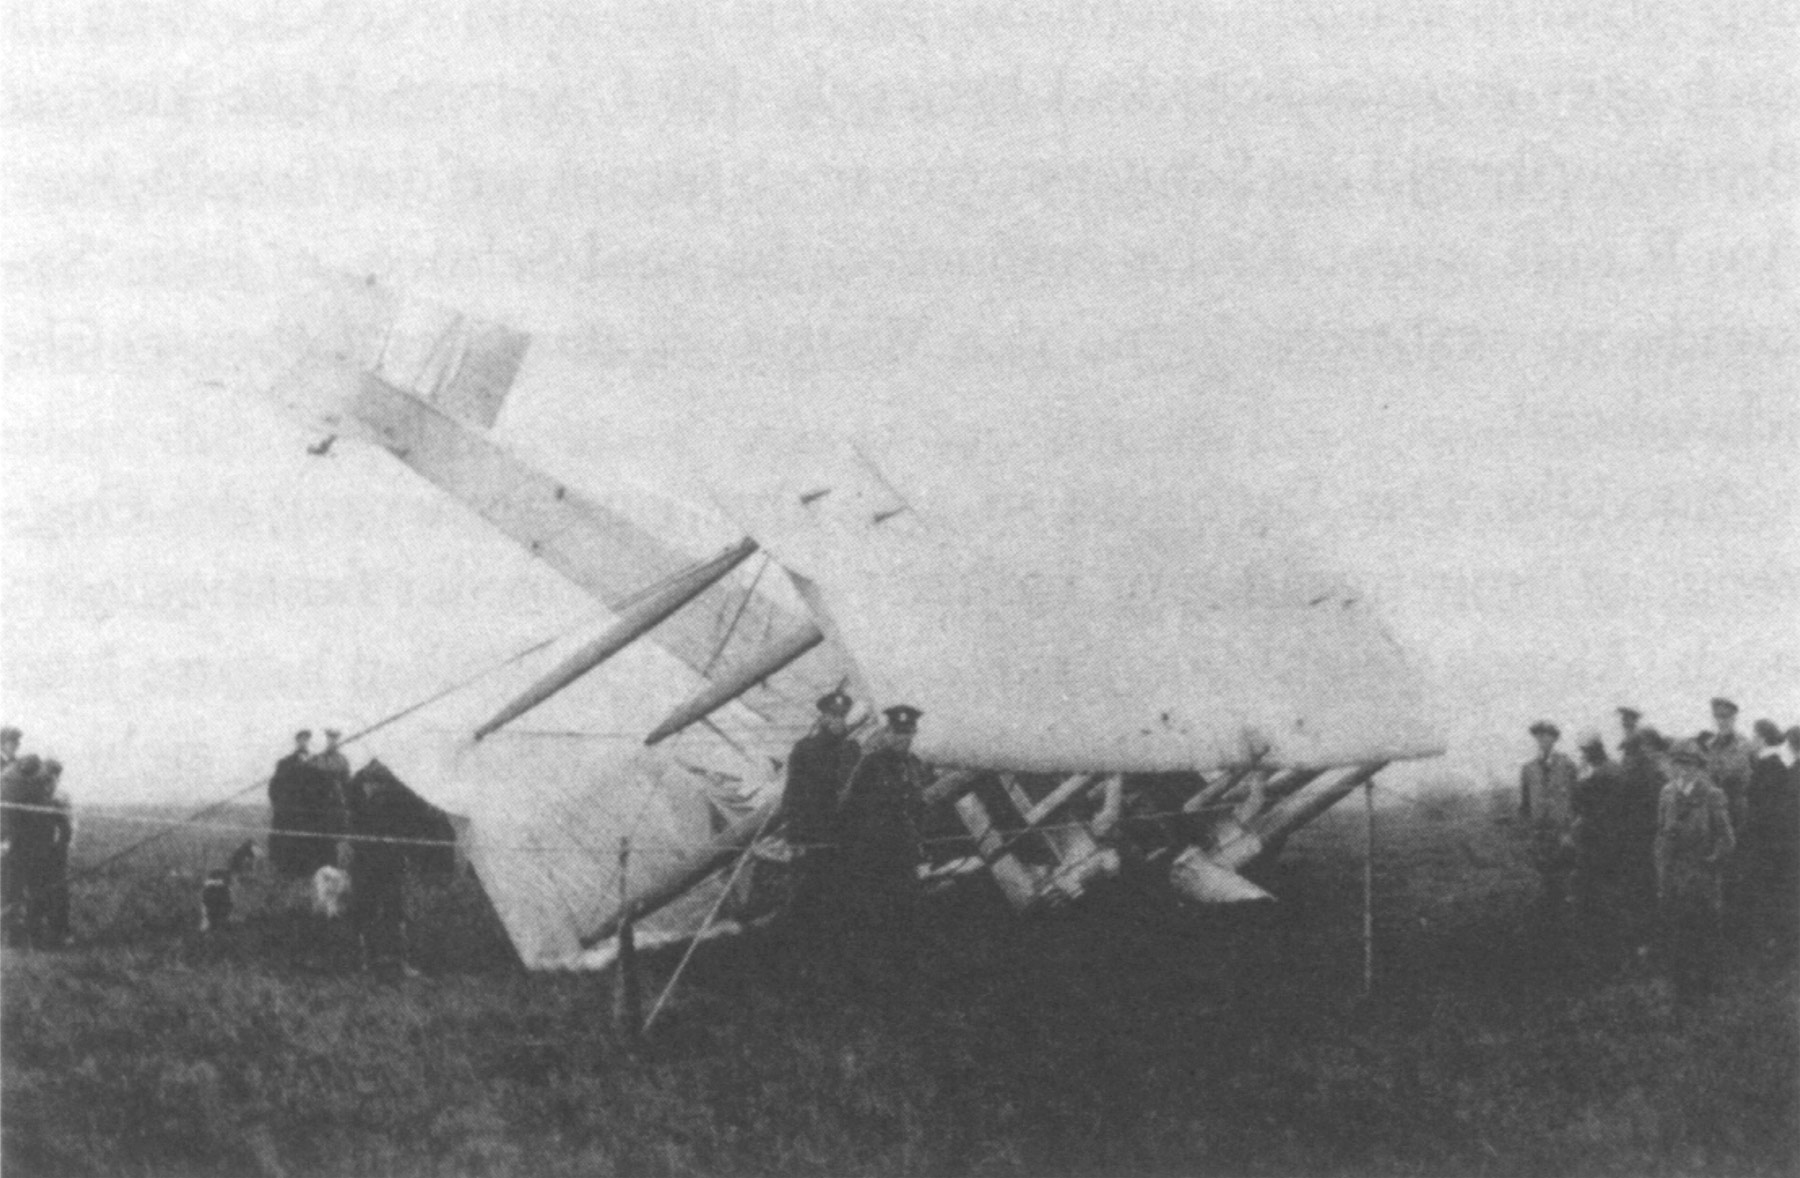
The first non-stop transatlantic flight
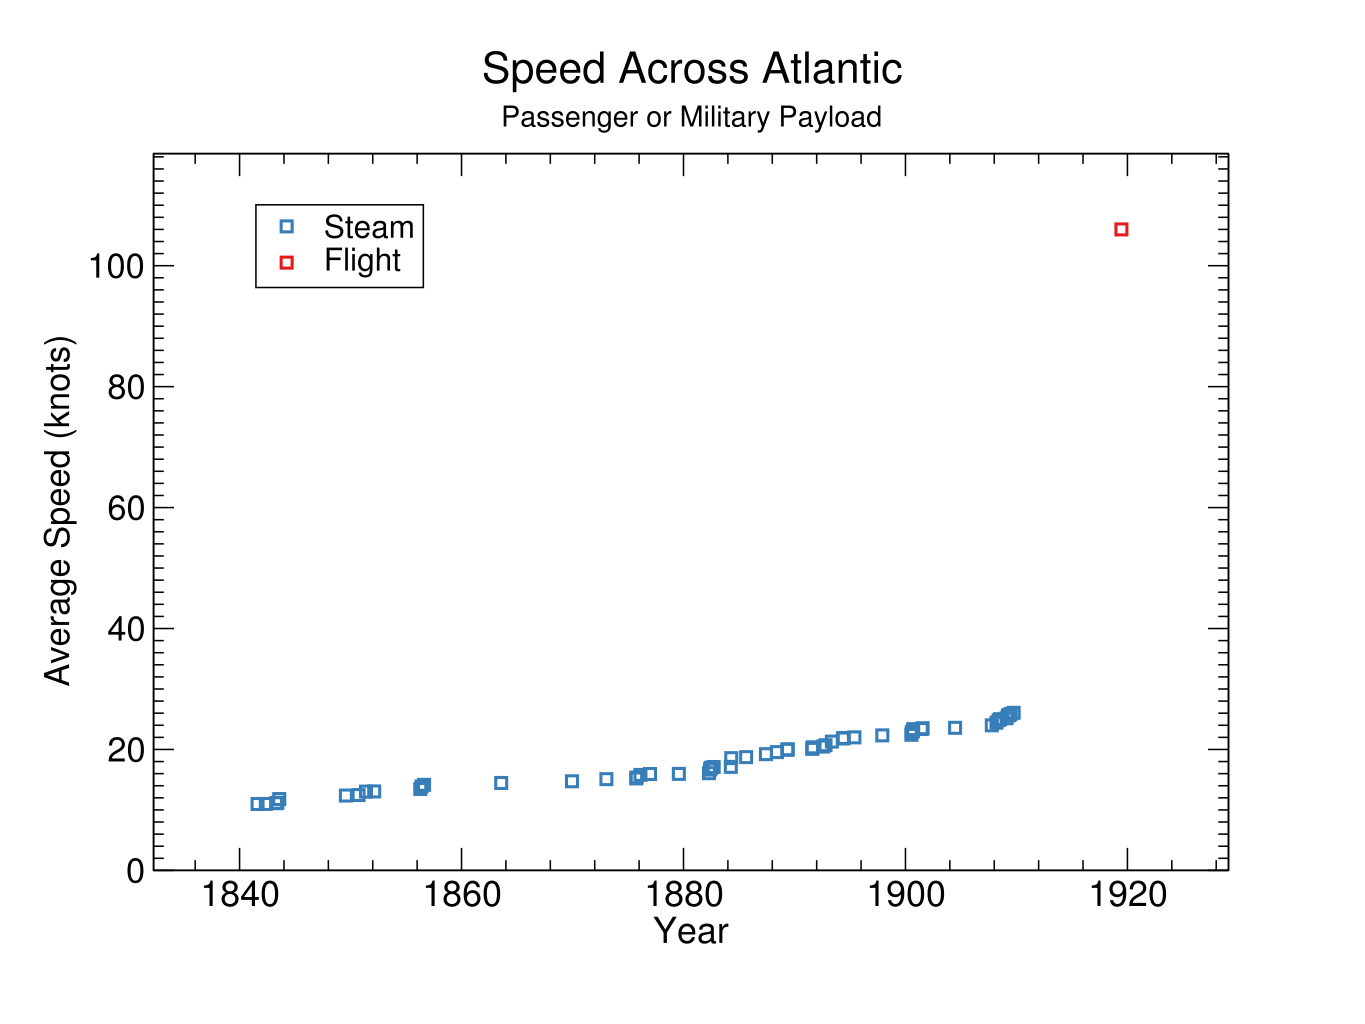
Discontinuity in both speed of passenger travel across the Atlantic Ocean and speed of military payload travel across the Atlantic Ocean
Ships were the fastest way to cross the Atlantic Ocean until the end of World War I. Passenger liners had been getting incrementally faster for about eighty years, and the fastest regular passenger liner was given a special title, ‘Blue Riband‘. Powered heavier-than-air flight got started in 1903, but at first planes only traveled hundreds of feet, and it took time to expand that to the 1600 or so miles needed to cross the Atlantic in one hop.19
The first non-stop transatlantic flight was made shortly after the end of WWI, in 1919. The Daily Mail had offered a large cash prize, on hold during the war, and with the resumption of peace, a slew of competitors prepared to fly. Alcock and Brown were the first to do it successfully, in a modified bomber plane, taking around 16 hours, for an average speed around four times faster than the Blue Riband.
One might expect discontinuities to be especially likely in a metric like ‘speed to cross the Atlantic’, which involves a sharp threshold on a non-speed axis for inclusion in the speed contest. For instance if planes incrementally improved on speed and range (and cost and comfort) every year, but couldn’t usefully cross the ocean at all until their range reached 1600 miles, then decades of incremental speed improvements could all hit the transatlantic speed record at once, when the range reaches that number.
Is this what happened? It looks like it. The Wright Flyer apparently had a maximum speed of 30mph. That’s about the record average ocean liner speed in 1909. So if the Wright Flyer had had the range to cross the Atlantic in 1903 at that speed, it would have been about six years ahead of the ship speed trend and wouldn’t have registered as a substantial discontinuity. 20 But because it didn’t have the range, and because the speed of planes was growing faster than that of ships, in 1919 when planes could at last fly thousands of miles, they were way ahead of ships.
The George Washington Bridge
Discontinuity in longest bridge span
A bridge ‘span‘ is the distance between two intermediate supports in a bridge. The history of bridge span length is not very smooth, and so arguably full of discontinuities, but the only bridge span that seems clearly way out of distribution to me is the main span of the George Washington Bridge. (See below.)

I’m not sure what made it so discontinuously long, but it is notably also the world’s busiest motor vehicle bridge (as of 2016), connecting New York City with New Jersey, so one can imagine that it was a very unusually worthwhile expanse of water to cross. Another notable feature of it was that it was much thinner relative to its length than long suspension bridges normally were, and lacked the usual ‘trusses’, based on a new theory of bridge design.21

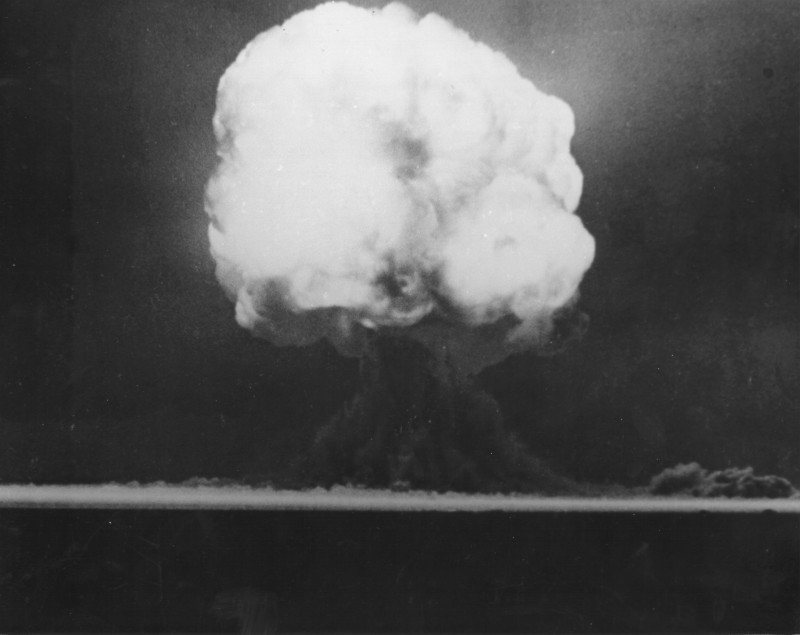
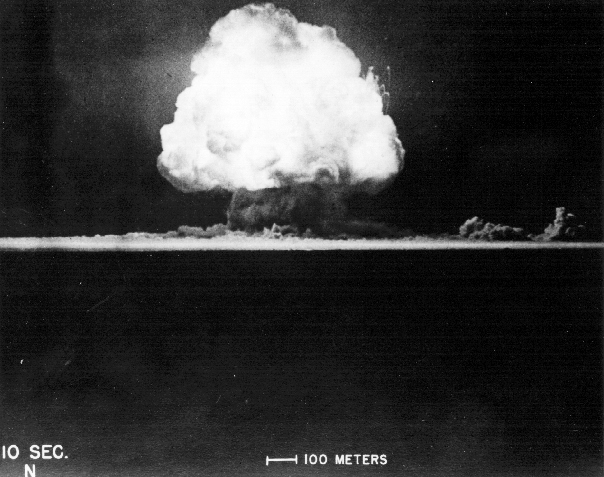
Nuclear weapons
Discontinuity in relative effectiveness of explosives
The ‘relative effectiveness factor‘ of an explosive is how much TNT you would need to do the same job.22 Pre-nuclear explosives had traversed the range of relative effectiveness factors from around 0.5 to 2 over about a thousand years, when in 1945 the first nuclear weapons came in at a relative effectiveness of around 450023.

A few characteristics of nuclear weapons that could relate to their discontinuousness:
- New physical phenomenon: nuclear weapons are based on nuclear fission, which was recently discovered, and allowed human use of nuclear energy (which exploits the strong fundamental force) whereas past explosives were based on chemical energy (which exploits the electromagnetic force). New forms of energy are rare in human history, and nuclear energy stored in a mass is characteristically much higher than chemical energy stored in it.
- Massive investment: the Manhattan Project, which developed the first nuclear weapons, cost around $23 billion in 2018 dollars. This was presumably a sharp increase over previous explosives research spending.
- Late understanding: it looks like nuclear weapons were only understood as a possibility after it was well worth trying to develop them at a huge scale.
- Mechanism involves a threshold: nuclear weapons are based on nuclear chain reactions, which require a critical mass of material (how much varies by circumstance).
I discussed whether and how these things might be related to the discontinuity in 2015 here (see Gwern’s comment) and here.

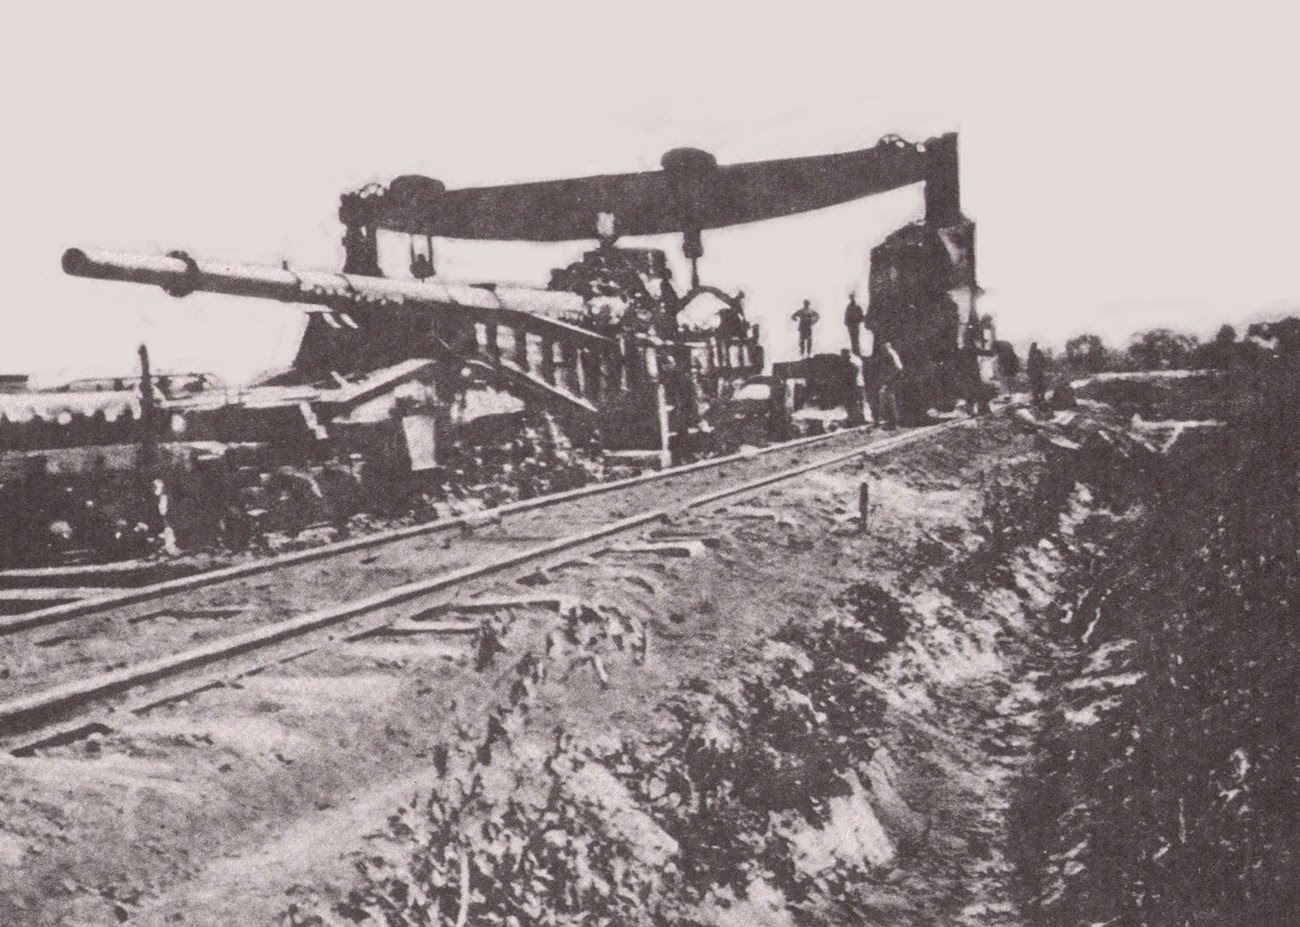
The Paris Gun
Discontinuity in altitude reached by man-made means
The Paris Gun was the largest artillery gun in WWI, used by the Germans to bomb Paris from 75 miles away. It could shoot 25 miles into the air, whereas the previous record we know of was around 1 mile into the air (also shot by a German gun).24
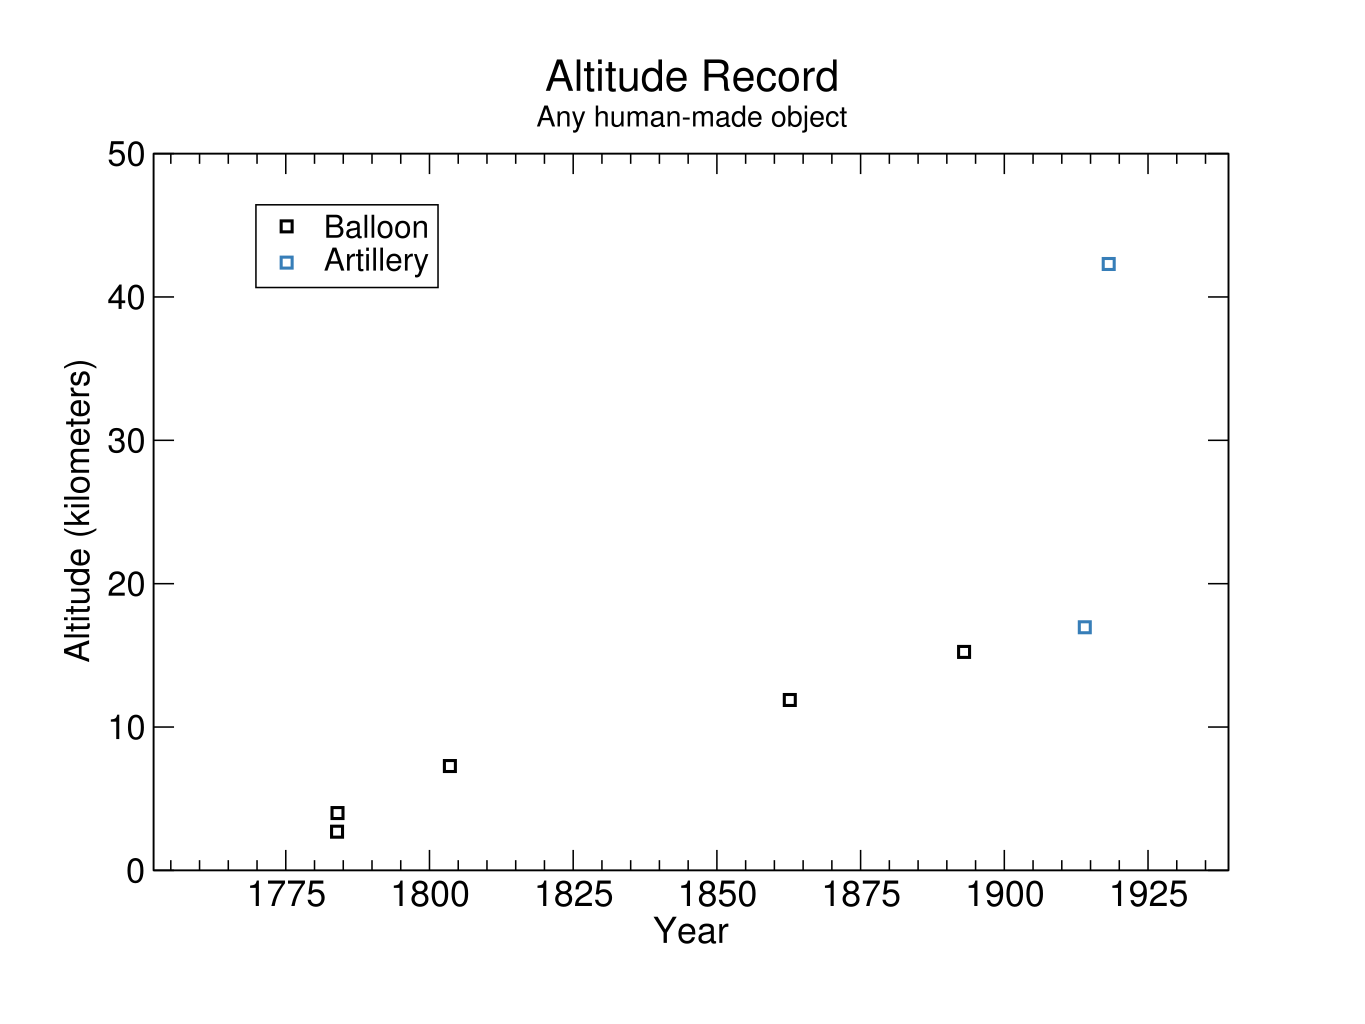
I don’t have much idea why the Paris Gun traveled so much higher than previous weapons. Wikipedia suggests that its goals were psychological rather than physically effective warfare:
As military weapons, the Paris Guns were not a great success: the payload was small, the barrel required frequent replacement, and the guns’ accuracy was good enough for only city-sized targets. The German objective was to build a psychological weapon to attack the morale of the Parisians, not to destroy the city itself.
This might explain an unusual trade-off of distance (and therefore altitude) against features like accuracy and destructive ability. On this story, building a weapon to shoot a projectile 25 miles into the air had been feasible for some time, but wasn’t worth it. This highlights the more general possibility that the altitude trend was perhaps more driven by the vagaries of demand for different tangentially-altitude-related ends than by technological progress.
The German military apparently dismantled the Paris Guns before departing, and did not comply with a Treaty of Versailles requirement to turn over a complete gun to the Allies, so the guns’ capabilities are not known with certainty. However it sounds like the shells were clearly observed in Paris, and the relevant gun was clearly observed around 70 miles away, so the range is probably not ambiguous, and the altitude reached by a projectile is closely related to the range. So uncertainty around the gun probably doesn’t affect our conclusions.
The first intercontinental ballistic missiles (ICBMs)
Discontinuity in average speed of military payload crossing the Atlantic Ocean
For most of history, the fastest way to send a military payload across the Atlantic Ocean was to put it on a boat or plane, much like a human passenger. So the maximum speed of sending a military payload across the Atlantic Ocean followed the analogous passenger travel trend. However in August 1957, the two abruptly diverged with the first successful test of an intercontinental ballistic missile (ICBM)—the Russian R-7 Semyorka. Early ICBMs traveled at around 11 thousand miles per hour, taking the minimum time to send a military payload between Moscow and New York for instance from around 14 hours to around 24 minutes.25
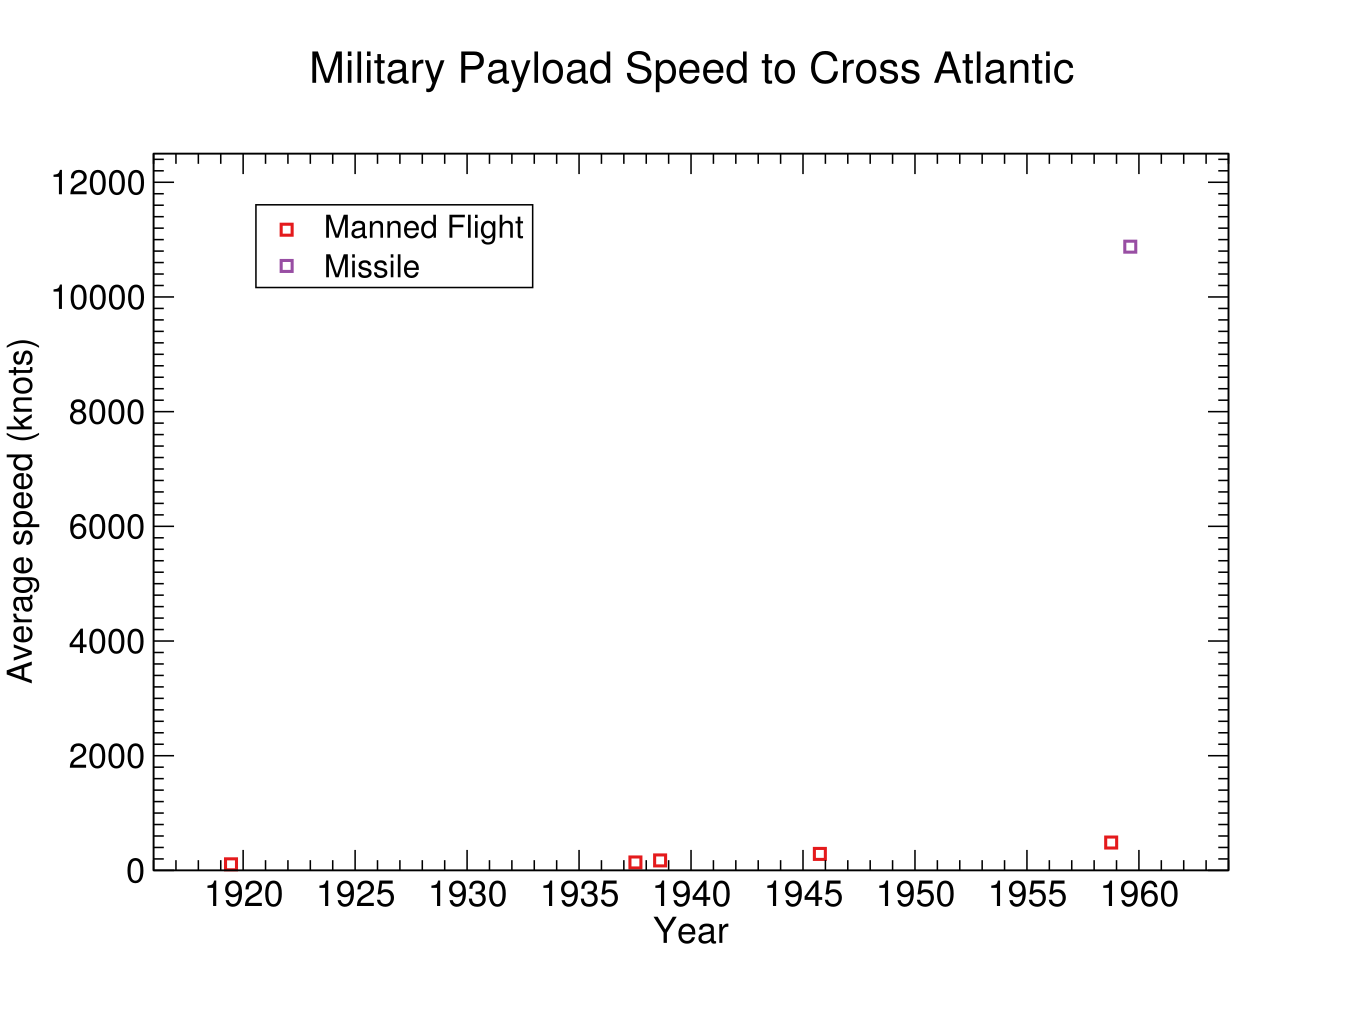
A ‘ballistic‘ missile is unpowered during most of its flight, and so follows a ballistic trajectory—the path of anything thrown into the air. Interestingly, this means that in order to go far enough to traverse the Atlantic, it has to be going a certain speed. Ignoring the curvature of the Earth or friction, this would be about 7000 knots for the shortest transatlantic distance—70% of its actual speed, and enough to be hundreds of years of discontinuity in the late 50s.26 So assuming ballistic missiles crossed the ocean when they did, they had to produce a large discontinuity in the speed trend.
Does this mean the ICBM was required to be a large discontinuity? No—there would be no discontinuity if rockets were improving in line with planes, and so transatlantic rockets were developed later, or ICBM-speed planes earlier. But it means that even if the trends for rocket distance and speed are incremental and start from irrelevantly low numbers, if they have a faster rate of growth than planes, and the threshold in distance required implies a speed way above the current record, then a large discontinuity must happen
This situation also means that you could plausibly have predicted the discontinuity ahead of time, if you were watching the trends. Seeing the rocket speed trend traveling upward faster than the plane speed trend, you could forecast that when it hit a speed that implied an intercontinental range, intercontinental weapons delivery speed would jump upward.

YBa2Cu3O7 as a superconductor
Discontinuity in warmest temperature of superconduction
When an ordinary material conducts electricity, it has some resistance (or opposition to the flow of electrons) which takes energy to overcome. The resistance can be gradually lowered by cooling the material down. For some materials though, there is a temperature threshold below which their resistance abruptly drops to zero, meaning for instance that electricity can flow through them indefinitely with no input of energy. These are ‘superconductors‘.
Superconductors were discovered in 1911. The first one observed, mercury, could superconduct below 4.2 Kelvin. From then on, more superconductors were discovered, and the warmest observed temperatures of superconduction gradually grew. In 1957, BCS theory was developed to explain the phenomenon (winning its authors a Nobel Prize), and was understood to rule out superconduction above temperatures of around 30K. But in 1986 a new superconductor was found with a threshold temperature around 30K, and composed of a surprising material: a ‘ceramic’ involving oxygen rather than an alloy.27 This also won a Nobel Prize, and instigated a rapid series of discoveries in similar materials—’cuprates‘—which shot the highest threshold temperatures to around 125 K by 1988 (before continued upward).
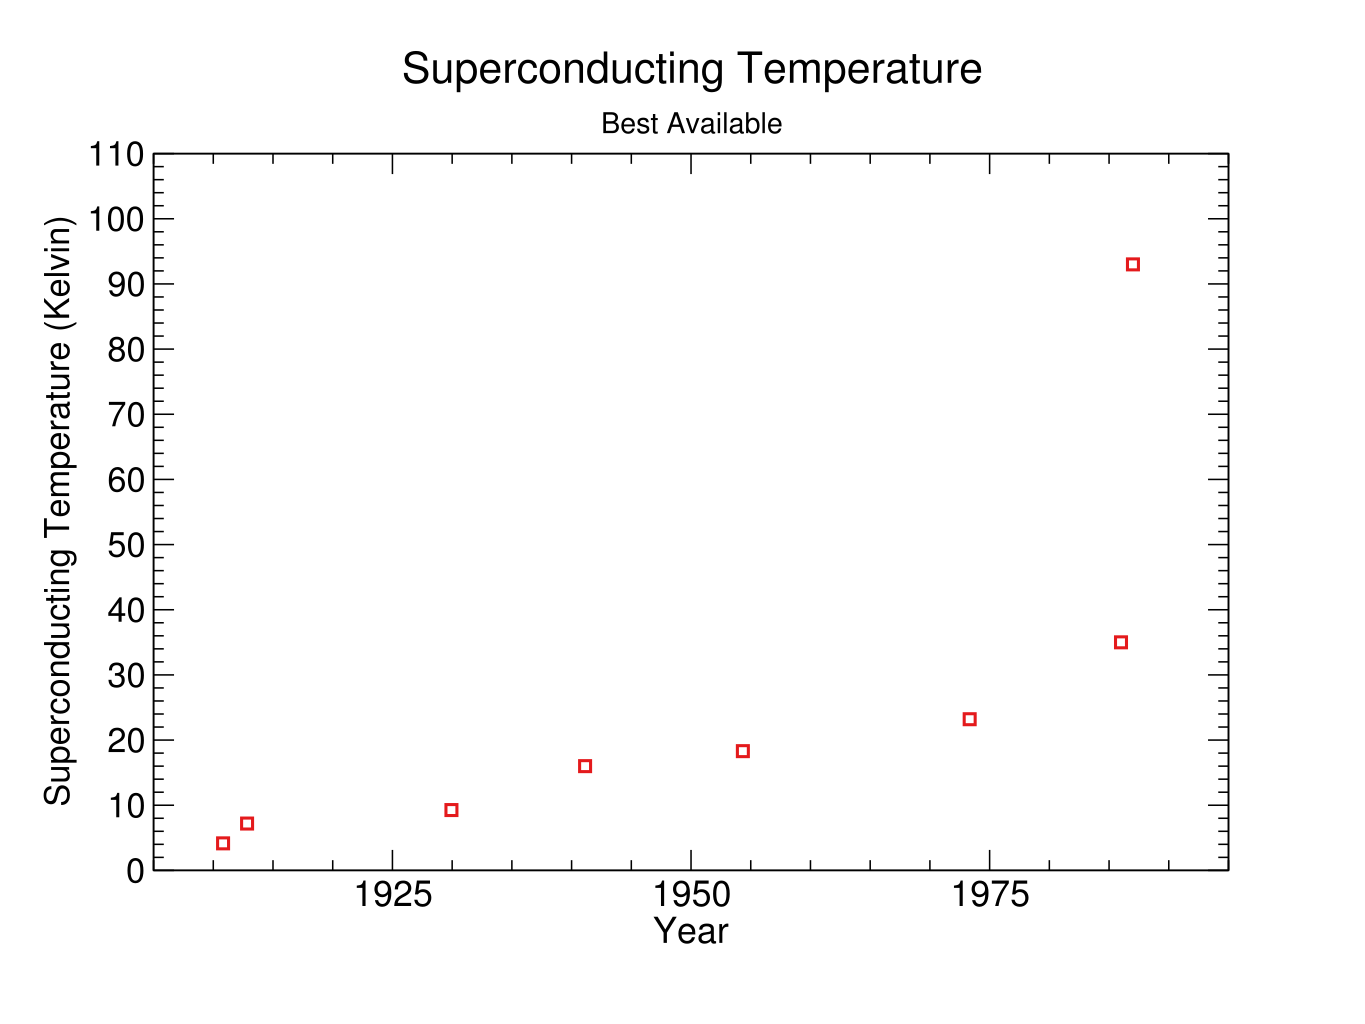
The first of the cuprates, LaBaCuO4, seems mostly surprising for theoretical reasons, rather than being radically above the temperature trend.28 The big jump came the following year, from YBa2Cu3O7, with its threshold at over 90 K.29
This seems like a striking instance of the story where the new technology doesn’t necessarily cause a jump so much as a new rate of progress. I wonder if there was a good reason for the least surprising cuprate to be discovered first. My guess is that there were many unsurprising ones, and substances are only famous if they were discovered before more exciting substances.

It is interesting to me that this is associated with a substantial update in very basic science, much like nuclear weapons. I’m not sure if that makes basic science updates ripe for discontinuity, or if there are just enough of them that some would show up in this list. (Though glancing at this list suggests to me that there were about 70 at this level in the 20th Century, and probably many fewer immediately involving a new capability rather than e.g. an increased understanding of pulsars. Penicillin also makes that list though, and we didn’t find any discontinuities it caused.)
Moderate robust discontinuities (10-100 years of extra progress):
The 10-100 year discontinuous events were:
- HMS Warrior, 1860 (discontinuity in both Royal Navy ship tonnage and Royal Navy ship displacement30)
- Eiffel Tower, 1889 (discontinuity in tallest existing freestanding structure height, and in other height trends non-robustly)
- Fairey Delta 2, 1956 (discontinuity in airspeed)
- Pellets shot into space, 1957, measured after one day of travel (discontinuity in altitude achieved by man-made means)31
- Burj Khalifa, 2009 (discontinuity in height of tallest building ever)
Other places we looked
Here are places we didn’t find robust discontinuities32) – follow the links to read about any in detail:
- Alexnet: This convolutional neural network made important progress on labeling images correctly, but was only a few years ahead of the previous trend of success in the ImageNet contest (which was also a very short trend).
- Light intensity: We measured argon flashes in 1943 as a large discontinuity, but I judge it non-robust. The rate of progress shot up at around that time though, from around half a percent per year to an average of 90% per year over the next 65 years, the rest of it involving increasingly intense lasers.
- Real price of books: After the invention of the printing press, the real price of books seems to have dropped sharply, relative to a recent upward trajectory. However this was not long after a similarly large drop purportedly from paper replacing parchment. So in the brief history we have data for, the second drop is not unusual. We are also too uncertain about this data to confidently conclude much.
- Manuscripts and books produced over the last hundred years: This was another attempt to find a discontinuity from the printing press. We measured several discontinuities, including one after the printing press. However, it is not very surprising for a somewhat noisy trend with data points every hundred years to be a hundred years ahead of the best-guess curve sometimes. The discontinuity at the time of the printing press was not much larger than others in nearby centuries. The clearer effect of the printing press at this scale appears to be a new faster growth trajectory.
- Bandwidth distance product: This measures how much can be sent how far by communication media. It was just pretty smooth.
- Total transatlantic bandwidth: This is how much cable goes under the Atlantic Ocean. It was also pretty smooth.
- Whitney’s cotton gin: Cotton gins remove seeds from cotton. Whitney’s gin is often considered to have revolutionized the cotton industry and maybe contributed to the American Civil War. We looked at its effects on pounds of cotton ginned per person per day, and our best guess is that it was a moderate discontinuity, but the trend is pretty noisy and the available data is pretty dubious. Interestingly, progress on gins was speeding up a lot prior to Whitney (the two previous data points look like much bigger discontinuities, but we are less sure that we aren’t just missing data that would make them part of fast incremental progress). We also looked at evidence on whether Whitney’s gin might have been a discontinuity in the more inclusive metric of cost per value of cotton ginned, but this was unclear. As evidence about the impact of Whitney’s gin, US cotton production appears to us to have been on the same radically fast trajectory before it as after it, and it seems people continued to use various other ginning methods for at least sixty years.
- Group index of light or pulse delay of light: These are two different measures of how slowly light can be made to move through a medium. It can now be ‘stopped’ in some sense, though not the strict normal one. We measured two discontinuities in group index, but both were relative to a fairly unclear trend, so don’t seem robust.
- Particle accelerator performance: natural measures include center-of-mass energy, particle energy, and lorentz factor achieved. All of these progressed fairly smoothly.
- US syphilis cases, US syphilis deaths, effectiveness of syphilis treatment, or inclusive costs of syphilis treatment: We looked at syphilis trends because we thought penicillin might have caused a discontinuity in something, and syphilis was apparently a key use case. But we didn’t find any discontinuities there. US syphilis deaths became much rarer over a period around its introduction, but the fastest drop slightly predates plausible broad use of penicillin, and there are no discontinuities of more than ten years in either US deaths or cases. Penicillin doesn’t even appear to be much more effective than its predecessor, conditional on being used.33 Rather, it seems to have been much less terrible to use (which in practice makes treatment more likely). That suggested to us that progress might have been especially visible in ‘inclusive costs of syphilis treatment’. There isn’t ready quantitative data for that, but we tried to get a rough qualitative picture of the landscape. It doesn’t look clearly discontinuous, because the trend was already radically improving. The preceding medicine sounds terrible to take, yet was nicknamed ‘magic bullet’ and is considered ‘the first effective treatment for syphilis‘. Shortly beforehand, mercury was still a usual treatment and deliberately contracting malaria had recently been added to the toolbox.
- Nuclear weapons on cost-effectiveness of explosives: Using nuclear weapons as explosives was not clearly cheaper than using traditional explosives, let alone discontinuously cheaper. However these are very uncertain estimates.
- Maximum landspeed: Landspeed saw vast and sudden changes in the rate of progress, but the developments were so close together that none was very far from average progress between the first point and the most recent one. If we more readily expect short term trends to continue (which arguably makes sense when they are as well-defined as these), then we find several moderate discontinuities. Either way, the more basic thing going on appears to be very distinct changes in the rate of progress.
- AI chess performance: This was so smooth that a point four years ahead of the trend in 2008 is eye-catching.
- Breech-loading rifles on the firing rate of guns: Breech-loading rifles were suggested to us as a potential discontinuity, and firing rate seemed like a metric on which they plausibly excelled. However there seem to have been other guns with similarly fast fire rates at the time breech-loading rifles were introduced. We haven’t checked whether they produced a discontinuity in some other metric (e.g. one that combines several features), or if anything else caused discontinuities in firing rate.
III. Some observations
Prevalence of discontinuities
Some observations on the overall prevalence of discontinuities:
- 32% of trends we investigated saw at least one large, robust discontinuity (though note that trends were selected for being discontinuous, and were a very non-uniform collection of topics, so this could at best inform an upper bound on how likely an arbitrary trend is to have a large, robust discontinuity somewhere in a chunk of its history)
- 53% of trends saw any discontinuity (including smaller and non-robust ones), and in expectation a trend saw more than two of these discontinuities.
- On average, each trend had 0.001 large robust discontinuities per year, or 0.002 for those trends with at least one at some point34
- On average 1.4% of new data points in a trend make for large robust discontinuities, or 4.9% for trends which have one.
- On average 14% of total progress in a trend came from large robust discontinuities (or 16% of logarithmic progress), or 38% among trends which have at least one
This all suggests that discontinuities, and large discontinuities in particular, are more common than I thought previously (though still not that common). One reason for this change is that I was treating difficulty of finding good cases of discontinuous progress as more informative than I do now. I initially thought there weren’t many around because suggested discontinuities often turned out not to be discontinuous, and there weren’t a huge number of promising suggestions. However we later got more good suggestions, and found many discontinuities where we weren’t necessarily looking for them. So I’m inclined to think there are a few around, but our efforts at seeking them out specifically just weren’t very effective. Another reason for a larger number now is that our more systematic methods now turn up many cases that don’t look very remarkable to the naked eye (those I have called non-robust), which we did not necessarily notice earlier. How important these are is less clear.
Discontinuities go with changes in the growth rate
It looks like discontinuities are often associated with changes in the growth rate. At a glance, 15 of the 38 trends had a relatively sharp change in their rate of progress at least once in their history. These changes in the growth rate very often coincided with discontinuities—in fourteen of the fifteen trends, at least one sharp change coincided with one of the discontinuities.35 If this is a real relationship, it means that if you see a discontinuity, there is a much heightened chance of further fast progress coming up. This seems important, but is a quick observation and should probably be checked and investigated further if we wanted to rely on it.
Where do we see discontinuities?
Among these case studies, when is a development more likely to produce a discontinuity in a trend?36 Some observations so far, based on the broader class including non-robust discontinuities, except where noted:
- When the trend is about products not technical measures
If we loosely divide trends into ‘technical’ (to do with scientific results e.g. highest temperature of a superconductor), ‘product’ (to do with individual objects meant for use e.g. cotton ginned by a cotton gin, height of building), ‘industry’ (to do with entire industries e.g. books produced in the UK) or ‘societal’ (to do with features of non-industry society e.g. syphilis deaths in the US), then ‘product’ trends saw around four times as many discontinuities as technical trends, and the other two are too small to say much. (Product trends are less than twice as likely to have any discontinuities, so the difference was largely in how many discontinuities they have per trend.) - When the trend is about less important ‘features’ rather than overall performance
If we loosely divide trends into ‘features’ (things that are good but not the main point of the activity), ‘performance proxies’ (things that are roughly the point of the activity) and ‘value proxies’ (things that roughly measure the net value of the activity, accounting for its costs as well as performance), then features were more discontinuous than performance proxies.37 - When the trend is about ‘product features’
(Unsurprisingly, given the above.) Overall, the 16 ‘product features’ we looked at had 4.6 discontinuities per trend on average, whereas the 22 other metrics had 0.7 discontinuities per trend on average (2 vs. 0.3 for large discontinuities).38 ‘Product features’ include for instance sizes of ships and fire rate of guns, whereas non-product features include total books produced per century, syphilis deaths in the US, and highest temperature of known superconductors. - When the development occurs after 1800
Most of the discontinuities we found happened after 1800. This could be a measurement effect, since much more recent data is available, and if we can’t find enough data to be confident, we are not deeming things discontinuities. For instance, the two obscure cotton gins before Whitney’s famous 1793 one that look responsible for huge jumps according to our sparse and untrustworthy 1700s data. The concentration of discontinuities since 1800 might also be related to progress speeding up in the last couple of centuries. Interestingly, since 1800 the rate of discontinuities doesn’t seem to be obviously increasing. For instance, seven of nine robust discontinuous events since 1900 happened by 1960.39 - When the trend is about travel speed across the Atlantic
Four of our ten robust discontinuous events of over a hundred years came from the three transatlantic travel speed trends we considered. They are also high on non-robust discontinuities. - When the trend doesn’t have a consistent exponential or linear shape
To measure discontinuities, we had to extrapolate past progress. We did this at each point, based on what the curve looked like so far. Some trends we consistently called exponential, some consistently linear, and some sometimes seemed linear and sometimes exponential. The ten in this third lot all had discontinuities, whereas the 20 that consistently looked either exponential or linear were about half as likely to have discontinuities.40 - When the trend is in the size of some kind of object
‘Object size’ trends had over five discontinuities per trend, compared to the average of around 2 across all trends. - When Isambard Kingdom Brunel is somehow involved
I mentioned Brunel above in connection with the Great Eastern. As well as designing that discontinuously large ship, which lay one of the discontinuously fast transatlantic telegraph cables, he designed the non-robustly discontinuous earlier ship Warrior.
I feel like there are other obvious patterns that I’m missing. Some other semi-obvious patterns that I’m noticing but don’t have time to actually check now, I am putting in the next section.
More things to observe
There are lots of other interesting things to ask about this kind of data, in particular regarding what kinds of things tend to see jumps. Here are some questions that we might answer in future, or which we welcome you to try to answer (and hope our data helps with):
- Are trends less likely to see discontinuities when more effort is going more directly into maximizing them? (Do discontinuities arise easily in trends people don’t care about?)
- How does the chance of discontinuity change with time, or with speed of progress? (Many trends get much faster toward the end, and there are more discontinuities toward the end, but how are they related at a finer scale?)
- Do discontinuities come from ‘insights’ more than from turning known cranks of progress?
- Are AI related trends similar to other trends? The two AI-related trends we investigated saw no substantial discontinuities, but two isn’t very many, and there is a persistent idea that once you can do something with AI, you can do it fast.41
- Are trends more continuous as they depend on more ‘parts’? (e.g. is maximum fuel energy density more jumpy than maximum engine power, which is more jumpy than maximum car speed?) This would make intuitive sense, but is somewhat at odds with the 8 ‘basic physics related’ trends we looked at not being especially jumpy.
- How does the specificity of trends relate to their jumpiness? I’d intuitively expect jumpier narrow trends to average out in aggregate to something smooth (for instance, so that maximum Volkswagen speed is more jumpy than maximum car speed, which is more jumpy than maximum transport speed, which is more jumpy than maximum man-made object speed). But I’m not sure that makes sense, and a contradictory observation is that discontinuities or sudden rate changes happen when a continuous narrow trend shoots up and intersects the broader trend. For instance, if record rocket altitude is continuously increasing, and record non-rocket altitude is continuously increasing more slowly but is currently ahead, then overall altitude will have some kind of corner in it where rockets surpass non-rockets. If you drew a line through liquid fuel rockets, pellets would have been less surprising, but they were surprising in terms of the broader measure.
- What does a more random sample of trends look like?
- What is the distribution of step sizes in a progress trend? (Looking at small ones as well as discontinuities.) If it generally follows a recognizable distribution, that could provide more information about the chance of rare large steps. It might also help recognize trends that are likely to have large discontinuities based on their observed distribution of smaller steps.
- Relatively abrupt changes in the growth rate seem common. Are these in fact often abrupt rather than ramping up slowly? (Are discontinuities in the derivative relevantly different from more object-level discontinuities, for our purposes?)
- How often is a ‘new kind of thing’ responsible for discontinuities? (e.g. the first direct flight and the first telegraph cable produced big discontinuities in trends that had previously been topped by ships for some time.) How often are they responsible for changes in the growth rate?
- If you drew a line through liquid fuel rockets, it seems like pellets may not be surprise, but they were because of the broader measure. How often is that a thing? I think a similar thing may have happened with the altitude records, and the land speed records, both also with rockets in particular. In both of those // similar thing happened with rockets in particular in land-speed and altitude? Could see trend coming up from below for some time.
- Is more fundamental science more likely to be discontinuous?
- With planes and ICBMs crossing the ocean, there seemed to be a pattern where incremental progress had to pass a threshold on some dimension before incremental progress on a dimension of interest mattered, which gave rise to discontinuity. Is that a common pattern? (Is that a correct way to think about what was going on?)
- If a thing sounds like a big deal, is it likely to be discontinuous? My impression was that these weren’t very closely connected, nor entirely disconnected. Innovations popularly considered a big deal were often not discontinuous, as far as we could tell. For instance penicillin seemed to help with syphilis a lot, but we didn’t find any actual discontinuity in anything. And we measured Whitney’s cotton gin as producing a moderate discontinuity in cotton ginned per person per day, but it isn’t robust, and there look to have been much larger jumps from earlier more obscure gins. On the other hand, nuclear weapons are widely considered a huge deal, and were a big discontinuity. It would be nice to check this more systematically.
IV. Summary
- Looking at past technological progress can help us tell whether AI trends are likely to be discontinuous or smooth
- We looked for discontinuities in 38 technological trends
- We found ten events that produced robust discontinuities of over a hundred years in at least one trend. (Djoser, Great Eastern, Telegraphs, Bridge, transatlantic flight, Paris Gun, ICBM, nukes, high temperature superconductors.)
- We found 53 events that produced smaller or less robust discontinuities
- The average rate of large robust discontinuities per year across trends was about 0.1%, but the chance of a given level of progress arising in a large robust discontinuity was around 14%
- Discontinuities were not randomly distributed: some classes of metric, some times, and some types of event seem to make them more likely or more numerous. We mostly haven’t investigated these in depth.
- Growth rates sharply changed in many trends, and this seemed strongly associated with discontinuities. (If you experience a discontinuity, it looks like there’s a good chance you’re hitting a new rate of progress, and should expect more of that.)
~
ETA: To be more clear, this is a blog post by Katja reporting on research involving many people at AI Impacts over the years, especially Rick Korzekwa, Asya Bergal, and Daniel Kokotajlo. The full page on the research is here.
Thanks to Stephen Jordan, Jesko Zimmermann, Bren Worth, Finan Adamson, and others for suggesting potential discontinuities for this project in response to our 2015 bounty, and to many others for suggesting potential discontinuities since, especially notably Nuño Sempere, who conducted a detailed independent investigation into discontinuities in ship size and time to circumnavigate the world42.
Notes
- Though we haven’t yet finished organizing to send bounties to people who earned them by sending us discontinuities. If this is you, you should hear from us soon; sorry for delay and thank you for your help.
- Note that an event can cause a discontinuity in many trends, but since arbitrarily many similar trends can be defined, the absolute number of events is more interesting. The number of discontinuities in trends is more meaningful as a fraction of trends considered.
- For instance, if a trend is noisy, short, sparse, or inconsistent, a departure from our best guess continuation of it is less surprising.
- If the trend is very ambiguous, then the jump has to be larger to be clearly outside of it. You can see my judgments in our meta-spreadsheet on the project, tab ‘Discontinuities’, column ‘Clear trend divergence?’.
- You can read about more of the complications on the methodology page. I have corrected enough errors that I can’t imagine there aren’t more. I wouldn’t be surprised if many details were corrected with more attention, and even if this list of robust discontinuous events among the the trends we considered changed by one or two items, but I would be surprised if it gained or lost more than three entries. Happily our question is about the rough landscape of very large effects, so small ambiguities are often unlikely to be relevant.
With this in mind, I have tried to limit the effort spent on sorting out things like apparent anomalies in the details of sixteenth century cotton export records, and my guess is that we have nonetheless gone too far in the direction of sorting them out. This is a general research methodology issue I am unsure about.
- Tallest ever structure, tallest ever freestanding structure, and tallest freestanding structure at the time, but these trends all coincide until later.
- Though I’m actually now confused about the Anu Zigurrat only standing at 13m tall, since my understanding is that it was a flat structure supporting a temple which looks around as tall as it again. I don’t think this changes whether the Pyramid of Djoser is a big discontinuity.
- apparently how cargo capacity used to be measured
- “The huge cargo holds never were filled to capacity, and in 1864, after years of deficit operation, the ship was sold to the Great Eastern Steamship Company, which used it as a cable vessel until 1874” – Encyclopedia Britannica
- Although designed to carry emigrants on the far Eastern run, the only passenger voyages Great Eastern made were in the Atlantic. Angus Buchanan, an historian of technology comments: “She was designed for the Far Eastern trade, but there was never sufficient traffic to put her into this. Instead, she was used in the transatlantic business, where she could not compete in speed and performance with similar vessels already in service.”” – Wikipedia
- On 9 September the ship had passed down the Thames, and out into the English Channel, and had just passed Hastings when there was a huge explosion, the forward deck blowing apart with enough force to throw the No. 1 funnel into the air, followed by a rush of escaping steam. Scott Russell and two engineers went below and ordered the steam to be blown off and the engine speed reduced. Five stokers died from being scalded by hot steam, while four or five others were badly injured and one had leapt overboard and had been lost.” – Wikipedia
- ”It was discovered that the rock had opened a gash in the ship’s outer hull over 9 feet (2.7 m) wide and 83 feet (25 m) long. The enormous size of Great Eastern precluded the use of any drydock repair facility in the US…”
- We know that the largest ship overall three years before the Great Eastern was a little bigger than the largest ship of the line, and don’t believe there were larger ships in between them. So we can reason that The Great Eastern represents at least roughly as big a discontinuity in total ship size as it would do in Royal Navy ship of the line size, if it were a royal navy ship of the line (which it was not). This is because the largest ships must have been at least as large as the Royal Navy ones, and the trends reached a similar point just before the Great Eastern, so the previous overall ship trend cannot have been much steeper on average than that of the Royal Navy.
- the record steamship speed of 14 knots would mean about nine days
- Five attempts to lay a cable were made over a nine-year period – one in 1857, two in 1858, one in 1865, and one in 1866.
- Test messages were sent from Newfoundland beginning August 10, 1858; the first successfully read at Valentia was on August 12…In September 1858, after several days of progressive deterioration of the insulation, the cable failed.” Wikipedia, Transatlantic telegraph cable
- “Field was undaunted by the failure. He was eager to renew the work, but the public had lost confidence in the scheme and his efforts to revive the company were futile. It was not until 1864 that, with the assistance of Thomas Brassey and John Pender, he succeeded in raising the necessary capital.” – Wikipedia
- “At noon on July 15, 1865, Great Eastern left the Nore for Foilhommerum Bay, Valentia Island, where the shore end was laid by Caroline. This attempt failed on July 31 when, after 1,062 miles (1968 km) had been paid out, the cable snapped near the stern of the ship, and the end was lost.[24]
Great Eastern steamed back to England, where Field issued another prospectus, and formed the Anglo-American Telegraph Company,[25] to lay a new cable and complete the broken one.” – Wikipedia
- Crossing in many hops between boats was an option, though presumably fairly large hops would still be needed to be competitive. The first multi-leg transatlantic flight took place in 1919, a few weeks before the first non-stop one, and took more than ten days, though the biggest hop was more than half the ocean and only took about 15 hours.
- This is ignoring the difference between maximum momentary speed and maximum average speed over thousands of miles—judging the Wright Flyer and the ocean liners consistently on one or the other of these, the Wright Flyer was probably not ahead of the trend at all.
- “When the upper deck was built, it was only 12 feet (3.7 m) thick without any stiffening trusses on the sides, and it had a length-to-thickness ratio of about 350 to 1.[11]:59, 61 At the time of the George Washington Bridge’s opening, most long suspension spans had stiffening trusses on their sides, and spans generally had a length-to-thickness ratio of 60 to 1.[11]:63[24] During the planning process, Ammann designed the deck around the “deflection theory”, an as-yet-unconfirmed assumption that longer suspension decks did not need to be as stiff in proportion to its length, because the weight of the longer deck itself would provide a counterweight against the deck’s movement.” – Wikipedia
- This is somewhat ambiguous, since there are different jobs, but since we are talking here about factors of more than a thousand, that probably isn’t important.
- for Fat Man, not the first, but close
- For smaller weapons, we often use the height they could theoretically reach if pointed straight up, regardless of whether we know of any specific occasion when that happened. For rare, immobile weapons like the Paris gun, we assume they were never shot straight upward, and use either written records of their maximum altitude, or the altitude implied by projectile motion at the optimal or recorded angle, traveling their range.
- Based on my rough calculations using distance and speed, not including other steps in military payload sending processes.
- Incidentally, the actual speed of the first ICBM looks like roughly what you need to get range from Russia to the USA, by my simple calculations, ignoring earth curvature.
- “What Bednorz and Müller did was to abandon the “conventional” materials – alloys of different composition. Since 1983 they have concentrated on oxides which, apart from containing oxygen, include copper and one or more of the rare earth metals. The new idea was that the copper atoms in a material of this kind could be made to transport electrons, which interact more strongly with the surrounding crystal than they do in normal electrical conductors. To obtain a chemically stable material the two researchers added barium to crystals or lanthanum-copper-oxide to produce a ceramic material that became the first successful “hightemperature” [sic] superconductor.”
NobelPrize.org. “The Nobel Prize in Physics 1987.” Accessed April 12, 2020. https://www.nobelprize.org/prizes/physics/1987/summary/.
- We do measure it as a 26 year discontinuity, but it doesn’t seem robust, because the trend wasn’t all that even beforehand.
- We have this as the second discovery, but I notice that this figure shows another one in between. Different sources also seem to list slightly different temperatures and chemical names for many of these records. None of this seems likely to change the conclusion that there was a large discontinuity from around 30K to around 90K in around 1987 involving something called roughly YBaCuO, which was an early cuprate but not the first.
- at least when modeled as linear or exponential as usual—see note above on the Great Eastern
- This was the first of various altitude records where the object continues to gain distance from Earth’s surface continuously for more than a year and perhaps indefinitely. One could choose to treat these in different ways, and get different size of discontinuity numbers. Strictly, all altitude increases are continuous, so we are anyway implicitly looking at something like discontinuities in heights reached within some period. We somewhat arbitrarily chose to measure altitudes roughly every year, including one day in for the pellets, the only one where the very start mattered. The interesting point is that progress was already robustly discontinuous measured after a day—you could get different size of discontinuity numbers with different specific measurement procedures.
- These places often saw discontinuities that weren’t robust, and they may still have robust discontinuities that we didn’t find. We are usually only looking at a trend for a certain period of time, so there may be discontinuities at other times, and our datasets are presumably somewhat inaccurate and incomplete.
- On a tentative survey of the literature, which is not enough evidence to be that confident.
- Across trends where it seemed reasonable to compare, not e.g. where we only looked at a single development. Also note that this is the average of discontinuity/years ratios across trends, not the number of discontinuities across all trends divided by the number of years across all trends.
- We haven’t really carefully measured this, so my numbers here might be a bit off.
- Remembering that this dataset is biased toward trends that people thought might be discontinuous, so e.g. it could be that A and B type trends both see discontinuities at the same rate, but outside observers are more likely to correctly identify discontinuities in A type trends, so most type A trends we look at have them, whereas type B trends do not.
- There were only three value proxy measures, with no discontinuities. Aside from the small number, these were also particularly hard trends to measure, so more likely to have discontinuities that we missed.
- That product features are much more likely to have discontinuities, and that we mostly look at product features is some evidence that we successfully directed our attention toward more discontinuous things. However it could also be that product features are relatively measurable, so we are both inclined to look at them, and can find discontinuities in them. For some of our metrics it was clear from the outset that it would be hard to find discontinuities if they were there, and we were checking for strong evidence of a discontinuity or a lack of discontinuity in spite of ambiguous information.
- See ‘timing of discontinuities’ tab in spreadsheet
- Another seven were neither of these, usually because it was too hard to find data, so we were mostly looking for evidence about whether a single data point was plausibly discontinuous without much longer term trend. This category saw no discontinuities.
- Somewhat at odds with our other minimal investigation
- Nuño Sempere. “Discontinuous Progress in Technological Trends.” Accessed March 8, 2021. https://nunosempere.github.io/rat/Discontinuous-Progress.html.

Chromium tanning seems to be a notable discontinuity in leather processing.