AI predictions from public statements made before and after 2000 form similar distributions. Such predictions from before 1980 appear to be more optimistic, though predictions from a larger early survey are not.
Discussion
Similarity of predictions over time
MIRI dataset
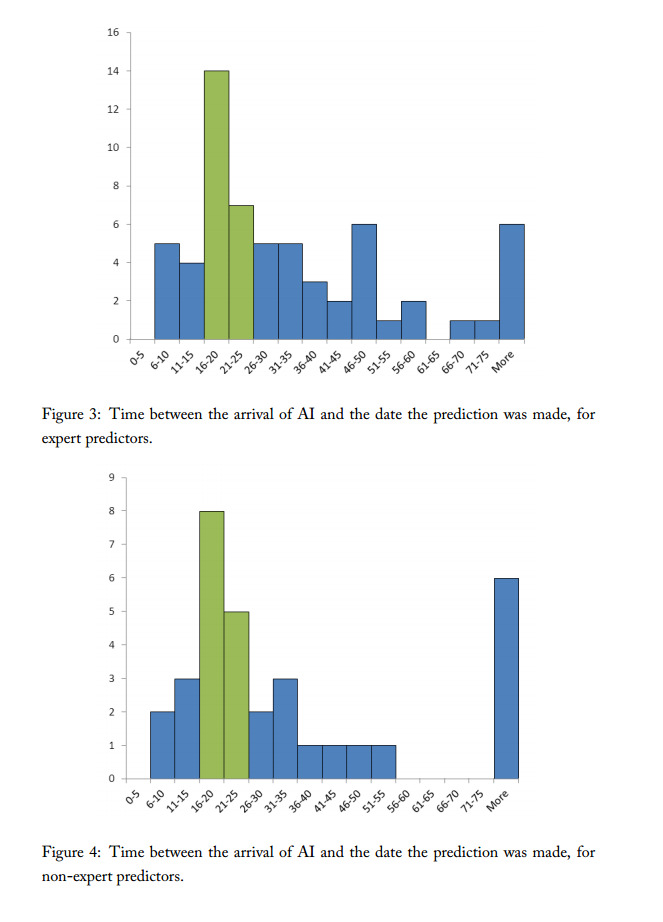
We compared early and late predictions using the MIRI dataset. We find the correlation between the date of a prediction and number of years until AI is predicted from that time is 0.13. Most predictions are in the last decade or two however, so this does not tell us much about long run trends (see Figure 1).
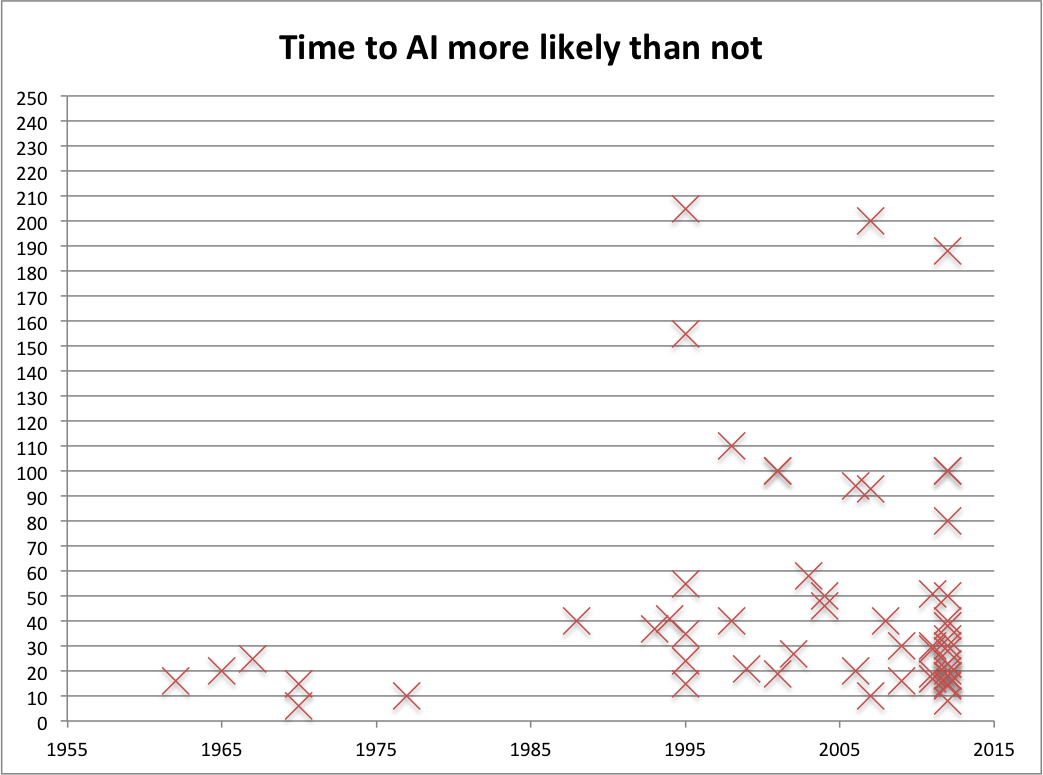
The six predictions prior to 1980 were all below the median 30 years, which would have less than 2% chance if they were really drawn from the same distribution.
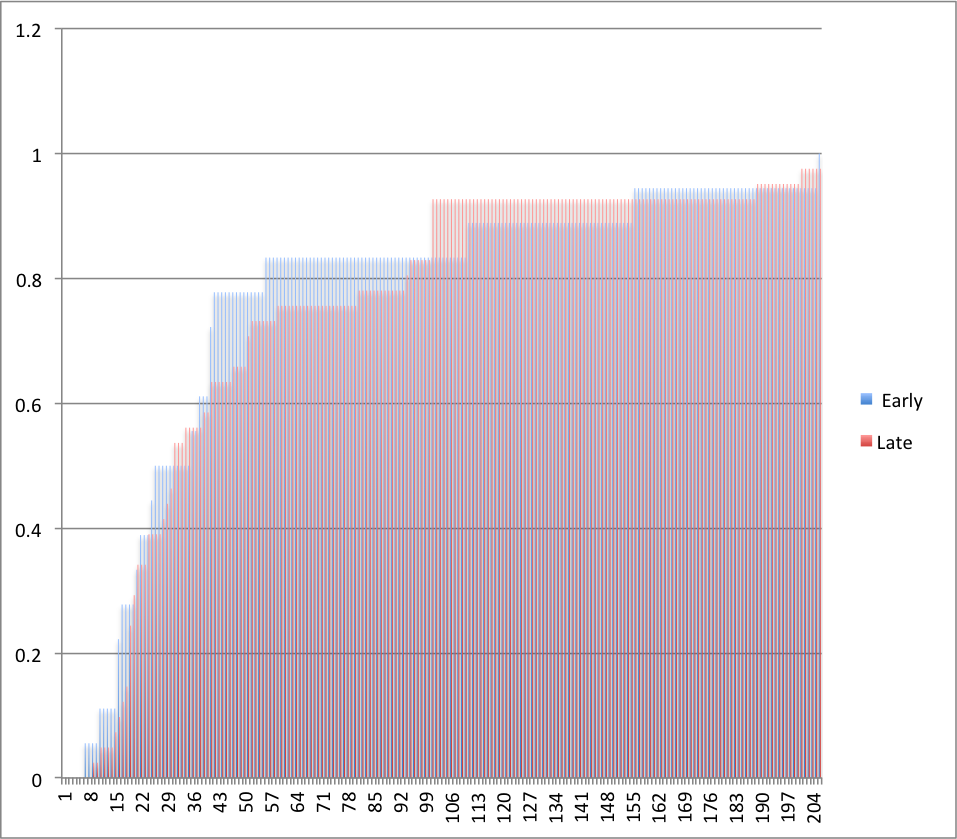
The predictions made before and after 2000 form very similar distributions however (see figure 2). The largest difference between the fraction of pre-2000 and since-2000 people who predict AI by any given distance in the future is about 15%. A difference this large is fairly likely by chance, according to our unpublished calculations. See the MIRI dataset page for further details.
Survey data
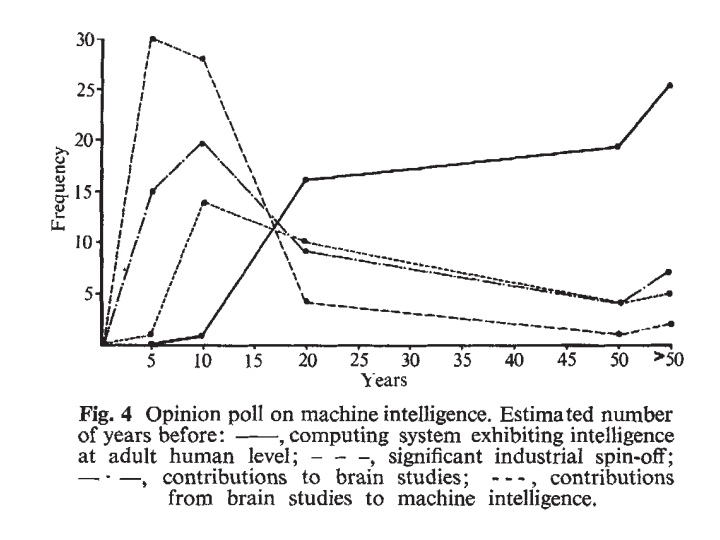
The surveys we know of provide some evidence against early predictions being more optimistic. Michie’s survey is the only survey we know of made more than ten years ago. Ten surveys have been made since 2005 that give median predictions or median fiftieth percentile dates. The median date in Michie’s survey is the third furthest out in the set of eleven: fifty years, compared to common twenty to forty year medians now. Michie’s survey does not appear to have involved options between twenty and fifty years however, making this result less informative. However it suggests the researchers in the survey were not substantially more optimistic than researchers in modern surveys. They were also apparently more pessimistic than the six early statements from the MIRI dataset discussed above, though some difference should be expected from comparing a survey with public statements. Michie’s survey had sixty-three respondents, compared to the MIRI dataset’s six, making this substantial evidence.
Armstrong and Sotala on failed past predictions
Armstrong and Sotala compare failed predictions of the past to all predictions, in an older version of the same dataset. This is not the same as comparing historical to contemporary predictions, but related. In particular, they use a subset of past predictions to conclude that contemporary predictions are likely to be similarly error-prone.
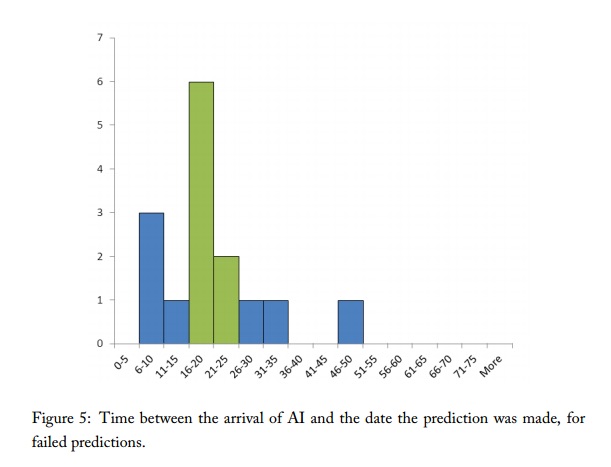
They find that predictions which are old enough to be proved wrong form a similar distribution to the entire set of predictions (see Figures 5-6). They infer that recent predictions are likely to be flawed in similar ways to the predictions we know to be wrong.
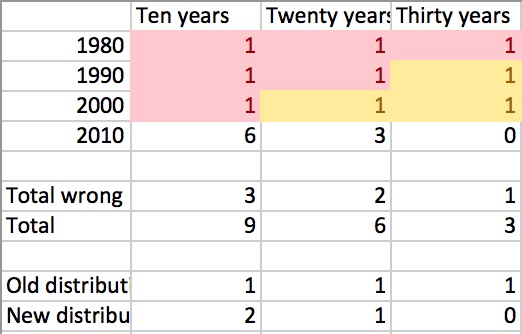
This inference appears to us to be wrong, due to a selection bias. Figure 4 illustrates how such reasoning fails with a simple scenario where the failure is clear. In this scenario, for thirty years people have divided their predictions between ten, twenty and thirty years out. In 2010 (the fictional present), many of these predictions are known to have been wrong (shown in pink). In order for the total distribution of predictions to match that of the past failed predictions, the modern predictions have to form a very distribution from the historical predictions (e.g. one such distribution is shown in the ‘2010’ row).
In general, failed predictions are disproportionately short early predictions, and also disproportionately short bad predictions. If the distributions of failed and total predictions look the same, this suggests that the distribution of early and late predictions is not the same – the later predictions must include fewer longer predictions, to make up for the longer unfalsified predictions inherited from the earlier dates, as well as the longer predictions effectively missing from the earlier dates.
If the characteristic lengths of the predictions was small relative to the time between different predictions, these biases would be small. In the example in figure 4, if the distance between the groups had been one hundred years, there would be no problem. However in the MIRI dataset, both are around twenty years.
In sum, the fact that failed predictions look like all predictions suggests that historical predictions came from a different distribution to present predictions. Which would seem to be good news about present predictions, if past predictions were bad. However, we have other evidence from comparing predictions from before and after 2000 directly that those are fairly similar (see above), so if earlier methods were unsuccessful, this is some mark against current methods. On the other hand, public predictions from before 1980 appear to be systematically more optimistic.
Implications
Accuracy of AI predictions: if people make fairly similar predictions over time, this is some evidence that they are not making their predictions based on information about their environment, which has changed over the decades (at a minimum, time has passed). For instance, some suspect that people make their predictions a fixed number of years into the future, to maximize their personal benefits from making exciting but hard to verify predictions. Evidence for this particular hypothesis seems weak to us, however the general point stands. This evidence against accuracy is not as strong as it may seem however, since there appear to be reasonable prior distributions over the date of AI which look the same after seeing time pass.

3 Trackbacks / Pingbacks
Comments are closed.