Survey participants (n = 83) were given anonymized descriptions of behavior in the wild for four animals: one bird species and one primate species with a similar neuron count, and one bird species and one primate species with twice as many neurons. Participants judged the two large-brained animals to display more intelligent behavior than the two smaller-brained animals on net, due to the large-brained animals’ substantial tool use being seen as a strong sign of intelligence, next to the small-brained animals absence of tool use. Other results were mixed. Participants did not judge either primates or birds to display more intelligent behavior.
1. Background
The existence of a correlation between brain size and intelligence across animal species is well-known (Roth & Dicke, 2005). Less clear is the extent to which brain size–in particular, neuron count–is responsible for differences in cognitive abilities between species. Here, we investigate one possible factor, the tissue organization of the cerebral cortex, by comparing cognitive abilities of animals with differing cortical architectures.
Primates make a natural target for comparison, since their intelligence has already been extensively studied. Additionally, comparing primate cognitive abilities to taxa that are farther from the human line may allow us to either confirm or deny the existence of a hard step for the evolvability of intelligence between primates and their last common ancestor with other large-brained animals (Shulman & Bostrom, 2012)1. Although some informal comparisons with other animals have been made, so far there have been few attempts to make detailed or quantitative comparisons between primate and non-primate intelligence.
There is only one extant alternative to primate cerebral architecture which has scaled to a similar size in terms of neuron count, that of birds, a lineage which diverged from our last common ancestor over 300 million years ago (for neuron counts of species across several lineages, see here). Avian cortical architecture appears strikingly different from primates and indeed all mammals (see 1.1). However, compared to primates, radically less research effort has gone into investigating bird intelligence in a way that would enable comparison with other species. Therefore, in addition to theoretical difficulties (see 1.3), we also face the practical difficulty of comparing bird and primate intelligence without the aid of a rich psychometric literature, as exists for humans. Despite this difficulty, we believe that the comparison is nonetheless worthwhile, as it could give us insight into the flexibility of possible solutions to the problem of intelligence, given “hardware” of sufficient size.
For instance, if primates performed especially well relative to their absolute number of brain neurons or brain energy budget, this might indicate that primate cortical architecture (or some other systematic difference between primate and avian brains) was especially well-suited to producing intelligence. Furthermore, it would suggest that the evolution of biological intelligence faced design-related bottlenecks moreso than energy- or “hardware” bottlenecks. Likewise, if bird and primate architectures perform similarly despite different organization, this at the very least would indicate that the space of “wetware” architectures that lent themselves to the successful implementation of intelligence was larger than one. More speculatively, it could be taken as a sign that working brain architectures are fairly easy to come by, given a sufficient number of neurons and/or a sufficiently high brain energy budget.
1.1 Mammalian vs avian brains: Similarities and differences
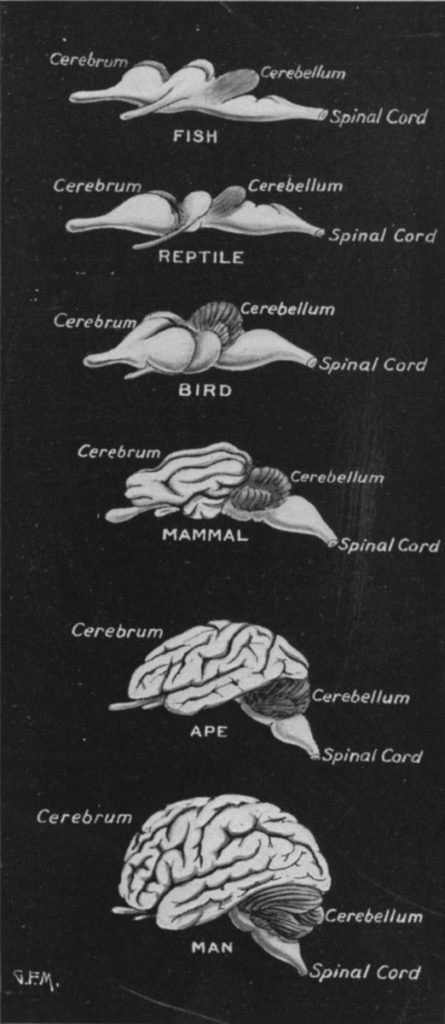
The usefulness of the comparison between birds and primates relies on the degree to which the same resources (a particular quantity of brain neurons) are arranged differently. At a glance, the majority of tissue in the avian and primate brains appears to be quite different, as the structure which evolved after the divergence point 300 million years ago–the cerebral cortex–occupies ~80% of the volume of both avian and primate brains. However, there is nonetheless a great deal of overlap in non-cerebral structures, and there is even reason to believe that the cerebral cortex has more commonality between bird and primate than might naively be expected (Kaas, 2017).
In the central nervous system, the common structures shared by mammals and birds include the spinal cord, the hindbrain, and the midbrain. These regions are primarily responsible for non-cognitive processes such as autonomic, sensorimotor, and circadian functions. Although each of these structures underwent changes to accommodate differences in body plan, environment, and niche, they are overall quite similar. Additionally, they have an unambiguously homologous (that is, similar by virtue of common descent) relationship in birds and mammals (Güntürkün, Stacho, & Strockens, 2017).
Atop the midbrain sits the forebrain, in particular the telencephalon, which is evolution’s most recent addition and the region which displays the most novel properties. The lower portion of the forebrain (the basal ganglia) is likely homologous between birds and mammals, but beyond this point the architectures diverge markedly. This uppermost layer is known as the pallium, or more commonly as the cerebral cortex in mammals.
Most of the mammalian cerebral cortex can be classed as neocortex. Neocortex spans six horizontally-oriented layers, with neurons organized into vertical columns, which may both interact with adjacent columns, and also send efferents (outgoing fibers) to distant columns or even locations farther afield in the nervous system. (However, some areas of mammalian cerebral cortex, such as parts of the hippocampus, have only three or four cell layers.) In contrast, the analogue to our neocortex in birds–the pallium–contains no layers or columns, and neurons are instead organized into nuclei. The extent to which the neocortex and the avian pallium are elaborations on pre-existing structures (and therefore homologous), versus de novo inventions of early mammals/birds, is still debated (Puelles et al., 2017). However, it is interesting to note that the most abundant type of neuron in mammalian cerebral cortex, the excitatory pyramidal cell, is also common in the avian pallium, having originated in an early vertebrate ancestor (Naumann & Laurent, 2017).
The most immediately obvious difference between mammalian brains and avian brains is their size. For an animal adapted for flight, bulk would have been particularly costly, and this pressure probably forced neurons to become smaller and more tightly packed, resulting in a small brain dense with neurons (Olkowicz et al., 2016). However, neurons in mammal brains are both large relative to comparably sized bird brains, and also scale with the size of the brain. The only mammalian order exempt from this neuron scaling rule is primates (Herculano-Houzel, Collins, Wong, & Kaas, 2007). Therefore, although they still possess larger neurons than those of birds, primates were able to increase neuron count relatively efficiently through brain size increases, and are less constrained than birds with regard to size and weight limits.
Although it was reasoned that larger neurons would be more energetically expensive due to the maintenance cost of neurons even at rest, this has not been borne out empirically. At least in mammals, the per-neuron energy budget appears to be relatively constant within brain structures, and does not vary as a function of cell size (Herculano-Houzel, 2011). This finding has not been verified in birds, however the commonality of cell types across mammalian and avian brains suggests that it is likely true for birds as well. Interestingly, neuronal energy budget appears to differ substantially between brain structures: energy consumption by cerebral neurons, which are predominantly pyramidal cells, is an order of magnitude higher than that of cerebellar neurons, which are predominantly small granule cells.
This may have functional relevance for the final notable difference between primate and avian brains, the relative size of certain brain regions. While both bird and mammal brains are dominated volumetrically by the telencephalon (including the cerebral cortex/pallium), only in birds are the majority of neurons contained within this structure. In mammals, the densely-packed cerebellum expanded in tandem with the cerebrum,2 while this structure remained relatively small in birds.
This is a topic of some curiosity, since the cerebellum was previously thought to simply control motor processes. The observation that it scaled proportionally to brain size may have contributed to the popularity of the “encephalization quotient”, based on the notion that the amount of brain tissue required to control a body scales with the size of the body. However, more recent findings suggest a broader role for the cerebellum in humans, including in cognitive functions. If the cerebellum made a substantial contribution to cognition, it would call to mind several possible scenarios.
It’s possible that after it was no longer useful to improve motor control, developmental or other constraints made changing the brain’s scaling rules to de-emphasize the cerebellum costly. Instead of reassigning the brain’s volume budget, perhaps cerebellar tissue was repurposed to serve cognitive functions which had been pushed out of the cerebrum, a structure which had already become crowded enough to resort to lateralizing functions (relegating certain domains, like language, to one side of the brain exclusively, in contrast to the default in animals of bilateral function). Since the cerebrum and cerebellum are extremely cytoarchitecturally dissimilar, sharing neither cell types nor organization, this would be evidence of generality of function across different neural tissue types. Indeed, it would be more impressive than if bird and mammal cortex were functionally equivalent, since a mammal’s cerebellum bears far less resemblance to its neocortex than its neocortex does to a bird’s pallium.
Alternatively, birds may lack some novel functions which emerged in mammals as the result of the expanding cerebellum. Finally, the most disheartening possibility is that the extra cerebellar tissue in large-brained mammals represents an inferior allocation of brain tissue.
1.2 Common models of brain-based intelligence differences between species
Historically, there was much popular support for the idea that differences in brain size tracked differences in intelligence between species. Several variations on this theme have also built a following in the past century, including encephalization quotient, brain-to-body ratio, and neuron count. These could be called the “More is Better” class of models, where increases in intelligence across species are attributed to greater absolute amounts of brain tissue, neurons, synapses, etc, or to greater amounts relative to some expected amount.
Although among these models the most parsimonious currently appears to be neuron count (see here and Herculano-Houzel 2009), the intuitively appealing “relative size” models–encephalization quotient and brain-to-body ratio–may still have heuristic value in distinguishing between similarly-sized brains, despite lacking mechanistic explanatory power. This is because a relatively large investment in brain tissue compared to body size would imply stronger selection pressure for intelligence. However, in this case, the likely mechanism of the cognitive advantage falls under the next category.
The other class of models could be called “Structural Improvements”, where intelligence increases are attributed to improvements in brain architecture. At a gross brain level, the most popular of these models implicates the size of the forebrain, relative to the rest of the brain. Other possibilities in this space include tissue-level properties (such as whether cells are arranged into layers or nuclei), as well as much finer cytoarchitectural adjustments, altered developmental processes, functional properties of neurons, and features like gyrification (cortical folding).
While it’s certainly the case that both quantitative and qualitative changes factored into the development of higher intelligence, the degree to which one or the other explains the variance between species is not well understood. This uncertainty is due in part to the difficulty of measuring animal intelligence across a collection of species diverse enough to differ in both quantitative and qualitative brain characteristics. (Additionally, our understanding of qualitative interspecific differences that are less apparent than the architectural differences we focus on here is currently rather poor.) Such a set of animal species would tend to vary not simply in characteristics related to intelligence, but also in body plan, physical abilities, temperament, accessibility for human study, and the evolutionary pressures favoring intelligence in the species.
The nature of the intelligence construct adds a further layer of obscurity. While the general factor (g) is well-accepted among intelligence researchers with regard to humans (Carroll, 1997), the body of evidence in non-humans–and especially in non-primates–is small and somewhat conflicting (Burkart, Schubiger, & van Schaik, 2017). Furthermore, it’s likely that assumptions of generality hold less well in animals with low cognitive capacity (for instance, in insects).
1.3 Previous attempts to measure primate and avian intelligence
Our knowledge of primate intelligence is primarily informed by a diverse body of laboratory tasks that attempt to measure various aspects of cognition. While any particular task is likely to be a relatively weak signal of overall intelligence on its own, combining this result with the results of dissimilar tasks will tend to improve the measure, as has been found in human intelligence testing. Very few studies have attempted to administer such a battery of intelligence tasks at the level of an individual non-human subject; however, a ‘species-level battery’ may be assembled from the single-task results that do exist. Especially when this ‘species-level battery’ is based on a small number of tests, care must be taken to ensure that the procedures for administering tasks were the same across species. Luckily, the large amount of primate cognition research conducted in the last century allows the construction of a battery according to these criteria. The measurement of primate intelligence is discussed further here.
In comparison with primates, the collection of cognitive tests that have been administered to bird species is disappointingly sparse. There are few examples of directly comparable tasks that have been administered to multiple species, preventing the construction of a battery from laboratory tasks. Even rarer are tasks that would enable comparison between primate species and bird species.
An alternative methodology that has been validated in primates is based on observations of behavior in the wild. Because the cognitive abilities displayed in the laboratory are likely the result of behavioral adaptations to challenging physical or social environments, it stands to reason that certain species-typical behaviors should correlate with the average intelligence of the species; that is, species that act intelligent in the lab should act intelligent in the field. This approach was used by Reader and colleagues (2011), who found that the number of reports citing instances of several types of behavior (eg tool use, social learning) correlated with each other, supporting the existence of a general factor of intelligence in primates. Furthermore, these results correlated with the results of the laboratory test battery discussed above at 0.7.
2. Estimating animal intelligence by survey: Methods
Rather than conducting a comprehensive behavioral review across many genera, as Reader and colleagues did (see 1.3), we restricted our analysis to a small set of primates and birds which were matched for total neuron count. We then gathered behavioral observations from the academic literature on each species, attempting to draw evidence from all plausibly relevant domains of animal life, and used these to construct a questionnaire for ranking animal intelligence. This was then given to a small, non-random pilot sample, as well as a larger sample of Mechanical Turk workers. In addition to apparent difficulty of behaviors in several behavioral domains, participants were asked to rank the relevance of behavioral domains to intelligence, and this ranking was used to weight the within-domain scores. Where possible, we removed features of descriptions which would have identified an animal as a bird or a primate.
Although far below the standard demanded of well-validated measures of intelligence,3 we believe that the aggregated judgments of survey participants can offer some information about an agent’s intelligence due to the moderate correlation of peer-rated intelligence with measured IQ within humans. For instance, Bailey and Mettetal (1977) found that spouses’ ratings had a correlation of 0.6 with scores on the Otis Quick Scoring Test of Mental Ability, while Borkenau and Liebler (1993) found that acquaintances’ ratings had a correlation of 0.3 with test scores. Most impressively, they also found that strangers shown a short video of a subject reading from a script gave ratings of the subject’s intelligence that correlated at 0.38 with the subject’s actual test scores.
The problem of rating human intelligence from impressions is in some ways quite a different one from the rating of an unfamiliar species. One factor that could potentially make judgment of humans easier is that human society rewards intelligence by conferring certain forms of status differentially on those who display greater cognitive ability, in ways that are legible to both close associates (ie spouses) and total strangers. This means that individual raters are already benefiting from the aggregated judgments of many past raters (indeed, these positional signals may constitute the majority of evidence in low information situations like acquaintanceship). Additionally, humans have a natural point of reference for the behavior of other humans, and this familiarity probably allows much more accurate comparisons.
However, judgment of other humans may also suffer from several disadvantages that judgment of nonhuman animals does not. Because humans in the same social group often occupy a relatively narrow range of the intelligence distribution, raters are asked to distinguish between differences in behavior that are small in absolute terms. For example, in the studies cited above, samples were drawn from college populations, which are famously range-restricted. Furthermore, raters of humans likely do not have the full range of behavior available to draw evidence from when considering strangers, acquaintances, or even spouses. In contrast, we attempted to capture all potentially relevant behavioral domains in data collection for our survey. Finally, as each others’ main social competitors, humans probably have stronger conflicts of interest in evaluating the intelligence of other humans, and thus may be disincentivized to make completely honest judgments.
Overall, we expect our methodology to produce weaker results than what is possible for raters of human subjects, but not radically so. It should be noted that, because of the scarcity of psychometric data for the species studied, we were not able to verify a correlation with other measures of intelligence. However, it would be possible to validate some version of this methodology with species for which psychometric data does exist (see 4.2).
2.1 Study object selection
We chose to study four animals: one larger-brained specimen of each of bird and primate, and one smaller-brained specimen of each. Having already established a strong relationship between brain size and intelligence within architecture types (see here), varying both architecture type and size allowed us to consider the degree to which one architecture type consistently outperformed the other–for instance, if the smaller version of one architecture outperformed both smaller and larger versions of the other architecture, this would more strongly suggest superiority due to structure than would a performance difference in two architectures of similar size.
Since we were limited to only those species in which neuron count is known, and where there is overlap between birds and primates, we had only five primates to choose from, three of which had few instances of behavioral reports (the Northern greater galago, Otolemur garnettii; the common marmoset, Callithrix jacchus; and the gray mouse lemur, Microcebus murinus).
Of the remaining primates, the squirrel monkey (Saimiri sciureus) was the larger-brained, with 3.2 billion neurons. Only one bird, the blue and yellow macaw (Ara ararauna) was reported as having a similarly large number of neurons, at 3.1 billion. The smaller-brained primate, the owl monkey (Aotus trivirgatus) has less than half this number of neurons at 1.5 billion, and was matched by both the grey parrot (Psittacus erithacus) at 1.6 billion and a corvid, the rook (Corvus frugilegus), at 1.5 billion. Because of the close evolutionary relationship between the two selected primates (~30 million years divergence time for Saimiri and Aotus, according to TimeTree), we chose to focus on the parrots, who share a similar evolutionary relationship (~30 million years divergence time for Ara and Psittacus, versus ~80 million years for Ara and Corvus).
It was expected that the factor of two difference in neuron count between the larger- and smaller-brained samples would be substantial enough to provide some signal despite the noisy nature of behavioral data and analysis, without being so enormous as to render the results trivial. Supposing the relationship between intelligence and neuron count scaled logarithmically, the difference between our sample would be somewhat smaller than the difference between humans and chimpanzees, who differ by a factor of three. (In absolute terms, the neuron count difference is more comparable to neuron count differences between individual humans.) However, it is worth noting that, in our analysis of primate intelligence from lab tests, a factor of two difference was approximately the lower bound for reliably producing a difference in measured intelligence.
Because the features of a single species are often studied unevenly, we improved our coverage of the behavioral spectrum by broadening data collection to include all species in a genus. This is a common practice in the study of animal behavior, generally poses fewer problems than groupings at higher taxa, and prevented us from having to search multiple species names in cases where these had changed in the last century. Furthermore, although brain sizes varied somewhat within genera, the size distribution of the smaller-brained genera (Aotus and Psittacus) had little to no overlap with that of the larger-brained genera (Saimiri and Ara). Species in each genus with available brain size data are shown in the table below. It is probably the case that not all species listed in the table were represented in our data, and that some species were overrepresented within their genus, however in many cases the exact species was not specified in the source.
| Genus | Species/sample | Brain mass (g) |
| Aotus | trivirgatus (n = 2) | 15.7 |
| trivirgatus (other sources, n = 288) | 17.2 (SD = 1.6) | |
| azarai (n = 6) | 21.1 | |
| lemurinus (n = 34) | 16.8 | |
| Saimiri | sciureus (n = 2) | 30.2 |
| sciureus (other sources, n = 216) | 24.0 (SD = 2.0) | |
| boliviensis (n = 3) | 25.7 | |
| oerstedii (n = 81) | 21.4 | |
| Psittacus | erithacus (Olkowicz sample, n = 2) | 8.8 |
| erithacus (other sources, n = 1) | 6.4 | |
| Ara | ararauna (Olkowicz sample, n = 1) | 20.7 |
| ararauna (other sources, n = 20) | 17.0 | |
| chloropterus (n = 7) | 22.2 | |
| hyacinthus (n = 12) | 25.0 | |
| rubrogenys (n = 4) | 12.1 |
2.2 Behavioral data collection
For each genus, we searched English language journals for behavioral observations demonstrating learning, behavioral flexibility, problem-solving, social communication, and other traits that imply intelligence. We excluded observations that involved training or interaction with humans (such as the Alex studies).
A problematic element of this type of behavioral study is the disproportionate research effort focused on certain species over others, and in certain domains of behavior. While none of the animals studied had an especially large representation in the literature, Aotus, Ara and Psittacus were generally less well represented than Saimiri. In the case of Psittacus, a very large proportion of our data was drawn from two sources by a single author. Additionally, conventions regarding the way in which behavior was studied and which details of behavior were considered salient seemed to differ somewhat between ornithologists and primatologists. For instance, while the vocal repertoire and functional significance of vocalizations were frequently a topic of great interest to primatologists, at least in our sample, vocal communication was given a much more casual treatment by ornithologists. Therefore, our data may cause primates and birds to appear to have more qualitative differences in cognitive ability than actually exist.
In our analysis, we make no explicit attempt to correct for these differences in research effort, but do indicate areas of disproportionately high or low coverage of a species, and recommend that the reader bear these in mind when interpreting our results.
After collection, the behavioral observations were sorted into eight functional categories, including three which primarily involved interaction with the environment (tool use, navigation/range, and shelter selection), and five involving social interaction (group dynamics, mate dynamics, care of young, play, and predation prevention). For the accompanying data for each genus, see S1. Below are full descriptions of the eight behavioral categories.
2.2.1 Tool use
Tool use involves the manipulation of an intermediate object to affect a final object. In more sophisticated instances of this behavior, the intermediate object is modified from its original form to better serve its intended purpose. Some degree of tool use is widely reported among great apes and certain corvids, and is seldom seen in “lower” animals (Smith & Bentley-Condit, 2010). Tool use may draw on cognitive abilities such as planning, means-end reasoning, spatial or mechanical reasoning, and creativity. (However, it cannot be assumed that apparent tool use demonstrates any of these abilities–some simple animals can use objects as “tools” in a highly inflexible, presumably hard-coded way which requires no learning.)
Despite an extensive search, examples of tool use in the wild (or a wild-mimicking environment) were not found for either Aotus or Psittacus. However, since at least one of these animals (Psittacus) can display tool-using behaviors in environments with frequent human contact (for instance, in a laboratory or pet environment) (Janzen, Janzen, & Pond, 1976), it’s unlikely that that these animals have no capacity at all for developing tool use. Therefore, other explanations for the lack of tool use in the wild should be considered. For one, both species are somewhat more neophobic than Saimiri and Ara, and thus are less likely to interact with unfamiliar objects frequently enough to develop a use for them. Furthermore, both species are substantially less well-studied in the wild than Saimiri (but not Ara), and may simply use tools too infrequently or inconspicuously to be noticed.
However, because of its relative rarity, spontaneous tool use is often taken to be “absent until proven present” in an animal species, and we have adhered to this convention in the present study. Readers who disagree with this approach may regard the scores of Aotus and Psittacus on this metric as a lower bound.
The range and territory size of an animal are how far it typically travels on a day-to-day basis, and the total area in which its ranging happens, respectively. Since an animal that travels more distantly will encounter more different environments than one that travels less distantly, larger ranges or territory sizes could signal more behavioral flexibility. Additionally, large ranges or variable routes may be more taxing on memory.
Relatively little information was available in this category for Ara and Psittacus. One might also expect that the skills required for navigation on land would differ substantially from those required for air navigation. In the final version of the survey, we consolidated this category with the following category.
2.2.3 Shelter selection
Where an animal chooses to rest or nest is one of the most frequent decisions it makes, and for prey animals may be one of the more important for survival. When searching for shelter, some optimization criteria may place large demands on perceptual or planning abilities, or on memory.
In the final version of the survey, we consolidated this category with the category above. While neither category alone was judged by participants to contain a large amount of evidence for intelligence, we hoped that combining the two would improve the signal and balance a survey heavy on social behaviors.
2.2.4 Group dynamics
The dynamics of group interaction vary dramatically between species, and frequently even within species in different geographic locations. Social group size of non-herding animals (that is, animals that do not affiliate with conspecifics merely to reduce predation risk) is thought to be correlated with intelligence, and some theories of the evolution of higher intelligence implicate social competition or cooperation as a primary driver (Dunbar, 1998). Furthermore, the range and flexibility of an animal’s vocal or visual communication may indicate the level of complexity of the species’ social life. Often, animals that have close or important relationships with their conspecifics engage in social grooming behaviors.
Due to the amount and complexity of evidence that fell into this category, it was particularly difficult to consolidate these behaviors into a truly representative description of each species. In the final version of the survey, this category was consolidated into a new category, “Social dynamics”.
2.2.5 Mate dynamics
Mate dynamics includes sexual and pair bonding behavior, as well as behaviors relevant to sexual competition. Some examples of behavior that falls into this category are courtship behaviors, social grooming between mates, and joint territorial displays. Some pairbonded animals, particularly birds, engage in the majority of their social interactions with a mate, rather than with group members (Luescher, 2006).
In the final version of the survey, this category was consolidated into the category “Social dynamics”.
2.2.6 Care of young
As well as being an important social relationship in some species of animals, parent/offspring interaction during development generally holds clues about the degree to which learning influences an animal’s behavior, as well as whether an animal participates in social learning (that is, learning by mimicry or emulation of conspecifics) or trial-and-error learning. Longer development times and higher parental investment typically correlate with learning ability in a species.
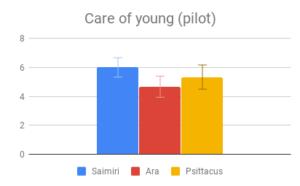
Aotus was not included in this comparison due to a lack of information. Psittacus and Ara had very poor representation in the literature compared to Saimiri. However, the category was retained due to its consistently high rating on the importance score.
2.2.7 Play
Play behavior is essentially a nonfunctional, simulated version of a functional behavior found in adult animals’ usual repertoire, and is more often seen in juvenile animals. Play probably exists to facilitate learning and practice of necessary skills, especially social ones. Play fighting is a very common form of play in social species.
Participants in our early Mechanical Turk sample did not find this category very informative, and indeed it is more a correlate of (or precursor to) intelligent behavior than intelligent in itself. It was therefore removed from the final version of the survey, although some details were preserved in the “Social dynamics” category.
2.2.8 Predation prevention
Animals evade predation through individual precautionary actions, threat signalling, and sometimes group coordination. Since offspring are both highly valuable and also more vulnerable to predation, much of the behavior in this category centers around defense of the nest. Associations between threat types and the amount of alarm appropriate may be learned to a greater or lesser degree in different species, as well as the proper form of the threat signal in the animal’s social group. Furthermore, threats may be classed into few or many types, facilitating greater or lesser nuance in response actions.
Participants in our early Mechanical Turk sample did not find this category very informative, and it was not easily subsumable into “Social dynamics”, so this category was struck from the final version of the survey.
2.3 Survey construction and procedures
We synthesized the reports from each category into a representative summary of a species’ behavior in that domain. Where possible, this included any details that might indicate the degree to which behaviors were learned, demonstrated flexibility across different environmental conditions, or were apparently supported by particular cognitive strategies. The summaries were then used to construct a questionnaire which asked participants to rate the apparent intelligence of behaviors against other behaviors in that same category. Afterward, participants were asked which categories they thought contained the most evidence about intelligence, on a scale of one to five. The questionnaire was given to a small random sample of Mechanical Turk workers (n = 12), as well as a small nonrandom panel composed of myself, Paul Christiano, Finan Adamson, Carl Shulman, Chris Olah and Katja Grace. Later, the questionnaire was condensed into four sections (tool use, navigation/shelter selection, social dynamics, and care of young) and given to a larger sample of Mechanical Turk workers (n = 104).
Because the term “intelligence” is somewhat value-laden and tends to have many idiosyncratic meanings attached to it, we chose to use the word “cognitive complexity” in its place. The hope was that this would reduce conflation with “rationality” or “adaptiveness”, which are both common lay misunderstandings of the term. We also attempted to reduce bias in survey responses by blinding participants to properties not directly relevant to the behaviors being described (including brain size and, wherever possible, membership in the bird or primate class).
2.3.1 Pilot survey
The pilot survey included all eight categories of behavior, as well as longer and more detailed summaries. Mechanical Turk participants were selected through the platform Positly, and the survey was administered using Google Forms. Participants were asked to rate the behaviors presented on a 10 point scale against others in the same category, not against behaviors that had been presented in previous categories, and were given the option of providing commentary. Participants were also asked to rate categories against each other for evidence of intelligence on a five point scale. All questions from this version can be found in S1, and participant responses can be found in S2.
Mechanical Turk data from this round of the survey was used to inform the abridgment of the final version. In particular, we removed or consolidated sections that had been rated by participants as less important, and adjusted the wording or level of detail on questions that seemed unclear to participants.
2.3.2 Final survey
The final version of the survey included four categories: tool use, navigation/shelter selection, social dynamics, and care of young. Social dynamics collapsed group dynamics, mate dynamics, and play. This version of the survey was administered via GuidedTrack, and added mandatory wait times to pages as well as a free response question assessing comprehension of the task instructions. Analysis was restricted to participants who were not rated as having poor comprehension (n = 77). All questions in this version can be found in S1, and participant responses can be found in S2.
3 Estimating animal intelligence by survey: Results
3.0.1 Pilot survey
We will present only the results from the small panel here, however the full data from this section can be found in the supplementary file.
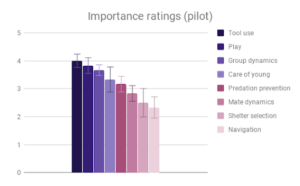
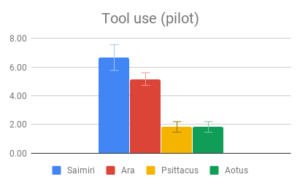
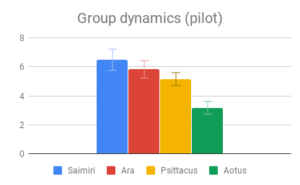
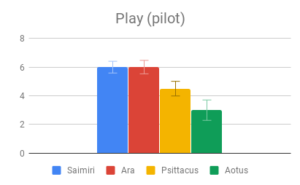
Tool use, Group dynamics, and Play emerged as the most important categories, according to participant rating, with Navigation & range and Shelter selection rated as least important. Across most categories, especially those rated as more important, there was strong agreement that Samiri, Ara and Psittacus outranked Aotus. There was also reasonably good agreement that Saimiri and Ara outranked Psittacus. Finally, Saimiri generally outranked Ara, though the effect was less strong than in the other comparisons.
Figure 2: Fields without scores (“Care of young” for Aotus) indicate that insufficient data was found to compose a behavioral description for that animal.
Given this data, participants appeared to find our small-brained primate, Aotus, to display the least intelligent behavior, and found our large-brained primate, Saimiri, to display the most intelligent behavior, although within a similar range to our large-brained bird, Ara.
3.0.2 Final survey
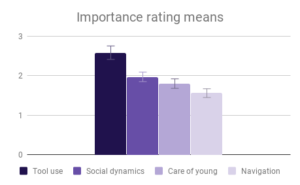
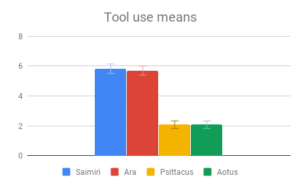
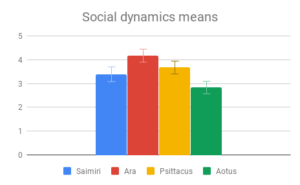
Among all four categories, participants reported that our descriptions of tool use provided the most evidence for intelligence, especially compared to the least informative category (Navigation and shelter selection). This aligned well with the pattern of answers within the category of Tool use, where there was strong agreement among participants on the rank order of Tool use behaviors, and the differences between Tool use behavior means were the largest of any category. The two larger-brained genera, Saimiri and Ara, were clear winners in this case, with participants reporting no significant difference between these two.
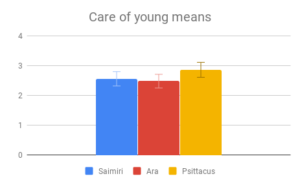
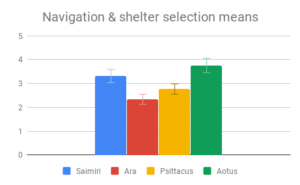
Social dynamics and Care of young were not clearly distinguishable from each other by importance rating, however participants responded quite differently to the evidence presented in these categories. All included genera (Saimiri, Ara and Psittacus) obtained about the same average score for Care of young, with no significant differences between them. However, for Social dynamics there were clear differences between the smaller-brained genera, Aotus and Psittacus, as well as the larger-brained bird and smaller-brained primate. Considering the borderline-significant comparison between Saimiri and Ara in this category (p=0.06), it would appear that participants rated birds slightly higher overall than primates on Social dynamics. Finally, Navigation and shelter selection was judged least important, but there were nonetheless clear differences in behavior scores between birds and primates, with primates outscoring birds, and no significant differences between sizes.
| Differences in means | ||||||
| Tool use vs Navigation / Shelter selection | Tool use vs Social dynamics | Tool use vs Care of young | Navigation / Shelter selection vs Social dynamics | Navigation / Shelter selection vs. Care of young | Social dynamics vs Care of young | |
| 1.0 +-0.2 (p<0.001) | 0.6 +-0.2 (p<0.001) | 0.8 +-0.2 (p<0.001) | -0.4 +-0.2 (p<0.01) | -0.2 +-0.2 (p=0.13) | 0.2 +-0.2 (p=0.32) |
| Saimiri vs Ara | Saimiri vs Aotus | Saimiri vs Psittacus | Ara vs Aotus | Ara vs Psittacus | Aotus vs Psittacus | |
| Tool use | 0.1 +-0.4 (p=0.79) | 3.7 +-0.4 (p<0.001) | (see Saimiri vs Aotus) | 3.6 +-0.4 (p<0.001) | (see Ara vs Aotus) | NA |
| Navigation / Shelter selection | 1.0 +-0.4 (p<0.01) | -0.5 +-0.4 (p=0.29) | 0.5 +-0.4 (p=0.13) | -1.5 +-0.4 (p<0.001) | -0.5 +-0.3 (p=0.15) | 1.0 +-0.4 (p<0.01) |
| Social dynamics | -0.8 +-0.4 (p=0.06) | 0.6 +-0.4 (p=0.16) | -0.3 +-0.4 (p=0.51) | 1.4 +-0.4 (p<0.001) | 0.5 +-0.4 (p=0.19) | -0.9 +-0.4 (p<0.01) |
| Care of young | 0.1 +-0.3 (p=0.83) | Not measured | -0.3 +-0.3 (p=0.38) | Not measured | -0.4 +-0.3 (p=0.27) | Not measured |
Figure 3: Fields without scores (“Care of young” for Aotus) indicate that insufficient data was found to compose a behavioral description for that animal.
Overall, participants in this sample seemed to find the largest and most important differences between the two large- and two small-brained animals, not between the two primates and two birds. However, they did rate the birds slightly higher on social behaviors, while the primates were rated slightly higher on Navigation and shelter selection.
It’s possible that since the Tool use section compared instances of a behavior with the absence of a similar behavior, differences in scoring may have been inflated, relative to comparison between a tool-using behavior and an unrelated behavior in a non-tool using animal. Indeed, it is probable that the non-tool using animals in our sample have some problem-solving behavior akin to tool use in their repertoire, which was simply subtle enough to go unremarked upon by investigators. This sort of behavior could be seen as a precursor to the development of spontaneous complex tool use, and is probably what enables captive Psittacus to learn to solve tool-type problems in a laboratory setting. It is nonetheless striking that both larger-brained genera had strong evidence of spontaneous tool use, being either a regular component of its day-to-day life or an impressively novel use for an unfamiliar object, while no reports of the smaller-brained genera in the wild mentioned comparable problem-solving behaviors.
4 Discussion
4.1 Conclusion
In all iterations, we found the survey method of estimating animal intelligence to be quite noisy, without strong agreement on the importance of some categories, or on the rankings of species within some categories. This is unsurprising, since participants were given descriptions of behaviors stripped of much potentially relevant context, in the interest of time, and were not experts in either intelligence or animal behavior. However, there was broad agreement between our participants in both versions of the survey on some high-level conclusions, namely: a) that tool use as presented was a particularly important source of evidence; and b) that, when rankings were weighted by importance as judged by participants, the two larger-brained animals outscored to the two smaller-brained animals.
Because of the small number of genera represented in our survey, it is difficult to draw strong conclusions about the relative contributions of neuron count, architecture, and other factors to intelligence. However, our data do not support the hypothesis that one tissue architecture is greatly superior to the other as a rule, and weakly supports the hypothesis that birds and primates with similar neuron numbers have similar cognitive abilities. In particular, given the behaviors described in our survey, participants were not able to systematically distinguish the two birds from the two primates across all categories, but were substantially more able to distinguish the small-brained animals from those with twice as many brain neurons.
We also did not see strong evidence of specialized intelligence that differed between the groups. That is, the two birds in our study seemed not clearly better or worse at any particular kinds of cognitively-demanding behaviors than the two primates. However, this is not a claim that none of the species involved have specialized abilities. We could easily imagine it being the case, for example, that if one were to place an owl monkey brain or a grey parrot brain in the body of an ostrich, both would perform similarly well at the cognitive challenges presented by ostrich life, while an owl monkey brain would not do nearly as well as a grey parrot brain at living the life of a grey parrot.
4.2 Implications and future directions
We hope our suggestive–if inconclusive–results spark greater interest in the highly neglected field of comparative animal intelligence. In particular, the further development and use of validated protocols for animal intelligence measurement seems to be a significant bottleneck to further progress. Furthermore, the gold standard of human psychometrics may not be a feasible model for animal intelligence measurement, given the prohibitive expense an analogous program in animals would incur (if traditional psychometric methods could even be applied usefully to most animals).
Our surveying method may represent an inexpensive alternative that can produce useable if imperfect results. Although we believe it has reasonably good theoretical support, the method is nonetheless unvalidated and would surely require refinement. To that end, future studies may consider applying our method to species where the rank order is more certain, such as humans and chimpanzees, or the collection of primate species that have been compared by a psychometric battery (see here).
With regard to the question of avian and primate per-neuron intelligence, our result has limited generalizability due to the small number of genera represented. Even within a broad architecture type, species may still vary in brain characteristics that are relevant to intelligence, and we might expect larger evolutionary distances within Primates or Aves to be reflected in brain differences. Idiosyncratic selective pressures of certain niches likely also have an impact here. In future, it may be fruitful to compare other orders of bird, such as Passeriformes (and especially Corvidae), with primates. As a particularly evolutionarily recent clade made up of strong ecological generalists, Corvidae might have developed structural improvements allowing them to excel in tool use and other cognitive abilities relative to other animals in their brain size class, and indeed there are at least many anecdotal reports of spontaneous tool use in wild corvids. There may also be interesting brain structure differences between New World primates, like the two represented in this study, and Old World primates.
Several limitations to the applicability of any bird-primate comparisons to the broader question surrounding architecture flexibility should be noted. Firstly, all brain structures other than the cerebral cortex are shared between birds and primates. Although these structures only account for a minority of brain volume, they could nonetheless perform some important precursor function to higher processing, such that an animal with a differently organized version could not perform as well cognitively, no matter their cortical architecture. This possibility seems less likely in light of the existence of cognitively advanced cephalopods like octopi, who are not vertebrates and therefore do not have a spinal cord or any other brain structures in common with birds and mammals.
Another issue pertains to scaling. While bird architectures clearly have the capacity to scale to the size of the smaller primate brains, no larger bird architectures have yet developed. This could be due to a number of limiting factors, including size limits imposed by the need to fly, a lack of adjacent niches that would support larger brains, or inherent randomness in the trajectory of brain evolution across lineages. However, it could also represent an upper bound on the scalability of bird-type cortical architecture.
5 Contributions
Research, analysis and writing were done by Tegan McCaslin. Editing and feedback were provided by Katja Grace and Justis Mills. Feedback was provided by Daniel Kokotajlo and Carl Shulman.
6 Bibliography
Bailey, R. C., & Mettetal, G. W. (1977). PERCEIVED INTELLIGENCE IN MARRIED PARTNERS. Social Behavior and Personality: An International Journal, 5(1), 137–141. https://doi.org/10.2224/sbp.1977.5.1.137
Borkenau, P., & Liebler, A. (1993). Convergence of stranger ratings of personality and intelligence with self-ratings, partner ratings, and measured intelligence. Journal of Personality and Social Psychology, 65(3), 546–553. https://doi.org/10.1037/0022-3514.65.3.546
Burkart, J. M., Schubiger, M. N., & van Schaik, C. P. (2017). The evolution of general intelligence. Behavioral and Brain Sciences, 40. https://doi.org/10.1017/S0140525X16000959
Carroll, J. B. (1997). Psychometrics, intelligence, and public perception. Intelligence, 24(1), 25–52. https://doi.org/10.1016/S0160-2896(97)90012-X
Dunbar, R. I. M. (1998). The social brain hypothesis. Evolutionary Anthropology: Issues, News, and Reviews, 6(5), 178–190. https://doi.org/10.1002/(SICI)1520-6505(1998)6:5<178::AID-EVAN5>3.0.CO;2-8
Güntürkün, O., Stacho, M., & Strockens, F. (2017). The brains of reptiles and birds. In J. H. Kaas (Ed.), Evolution of Nervous Systems (2nd ed., Vol. 1, pp. 171–221). Oxford, United Kingdom: Academic Press.
Herculano-Houzel, S., Collins, C. E., Wong, P., & Kaas, J. H. (2007). Cellular scaling rules for primate brains. Proceedings of the National Academy of Sciences, 104(9), 3562–3567. https://doi.org/10.1073/pnas.0611396104
Herculano-Houzel, Suzana. (2009). The human brain in numbers: a linearly scaled-up primate brain. Frontiers in Human Neuroscience, 3. https://doi.org/10.3389/neuro.09.031.2009
Herculano-Houzel, Suzana. (2011). Scaling of Brain Metabolism with a Fixed Energy Budget per Neuron: Implications for Neuronal Activity, Plasticity and Evolution. PLoS ONE, 6(3), e17514. https://doi.org/10.1371/journal.pone.0017514
Janzen, M. J., Janzen, D. H., & Pond, C. M. (1976). Tool-Using by the African Grey Parrot (Psittacus erithacus). Biotropica, 8(1), 70.
Kaas, J. H. (Ed.). (2017). Evolution of Nervous Systems (2nd ed.). Oxford, United Kingdom: Academic Press.
Luescher, A. U. (Ed.). (2006). Manual of parrot behavior (1st ed). Ames, Iowa: Blackwell.
Naumann, R., & Laurent, G. (2017). Function and evolution of the reptilian cerebral cortex. In J. H. Kaas (Ed.), Evolution of Nervous Systems (2nd ed., Vol. 1, pp. 491–518). Oxford, United Kingdom: Academic Press.
Olkowicz, S., Kocourek, M., Lučan, R. K., Porteš, M., Fitch, W. T., Herculano-Houzel, S., & Němec, P. (2016). Birds have primate-like numbers of neurons in the forebrain. Proceedings of the National Academy of Sciences, 113(26), 7255–7260. https://doi.org/10.1073/pnas.1517131113
Puelles, L., Sandoval, J., Ayad, A., del Corral, R., Alonso, A., Ferran, J., & Martinez-de-la-Torre, M. (2017). The pallium in reptiles and birds in light of the updated tetrapartite pallium model. In J. H. Kaas (Ed.), Evolution of Nervous Systems (2nd ed., Vol. 1, pp. 519–555). Oxford, United Kingdom: Academic Press.
Reader, S. M., Hager, Y., & Laland, K. N. (2011). The evolution of primate general and cultural intelligence. Philosophical Transactions of the Royal Society B: Biological Sciences, 366(1567), 1017–1027. https://doi.org/10.1098/rstb.2010.0342
Reiner, A., Yamamoto, K., & Karten, H. J. (2005). Organization and evolution of the avian forebrain. The Anatomical Record Part A: Discoveries in Molecular, Cellular, and Evolutionary Biology, 287A(1), 1080–1102. https://doi.org/10.1002/ar.a.20253
Smith, & Bentley-Condit, V. (2010). Animal tool use: current definitions and an updated comprehensive catalog. Behaviour, 147(2), 185-32A. https://doi.org/10.1163/000579509X12512865686555
Roth, G., & Dicke, U. (2005). Evolution of the brain and intelligence. Trends in Cognitive Sciences, 9(5), 250–257. https://doi.org/10.1016/j.tics.2005.03.005
Shulman, C., & Bostrom, N. (2012). How Hard Is Artificial Intelligence? Evolutionary Arguments and Selection Effects. Journal of Consciousness Studies, 19(7–8), 103–130.
- Due to the observer selection effect, the fact that the particular evolutionary line containing humans and directly related species (ie, primates) lead to high levels of intelligence is not sufficient evidence that intelligence is not hard for evolution to produce; another line evolving intelligence, independent of ourselves, represents much stronger evidence. (See Shulman & Bostrom 2012.)
- Note that there are several overlapping anatomical terms here: the cerebrum, a mammalian structure, encompasses the cerebral cortex, the folded gray tissue visible on the outside of the lobes, and the connective white matter below it. The analogue in birds is the pallium. Below the cerebrum/pallium are the basal ganglia, and these structures collectively make up the telencephalon (the latest developing embryonic structure, and a part of the forebrain).
- (Reviewer’s note) In AI, the current state of the art for estimating distance-to-AGI is to look at the capabilities of various AI systems and use intuition to make a guess at how intelligent they are compared to the imagined AGI. In comparison to this, the methodology shown here is an improvement.

4 Trackbacks / Pingbacks
Comments are closed.