This is a list of public datasets that we know of containing either measured or theoretical performance numbers for computer processors.
List
- Top 500 maintains a list of the top 500 supercomputers, updated every six months. It includes measured performance.
- List of Nvidia Graphics Processing Units contains GFLOPS figures for a large number of GPUs. Probably they are all theoretical peak performance numbers. It also contains release dates and release prices.
- List of AMD Graphics Processing Units is much like the list of Nvidia GPUs, but for the other leading GPU brand.
- Wikipedia’s FLOPS page contains a small amount of data, seemingly empirical, from a variety of sources.
- Wikipedia has other small collections of theoretical performance data. For instance on the Intel Xeon Phi page.
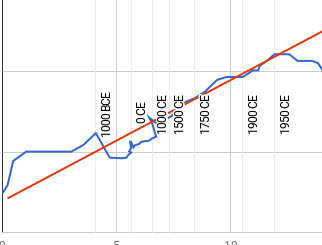
- Moravec has perhaps the oldest and best known dataset. We link to an article discussing it, but its actual page was down last we checked.
- Nordhaus expands on Moravec’s data.
- Koh and Magee expand on Moravec’s data.
- Rieber and Muehlhauser did have a dataset (discussed here) but links to it appear to be broken.
- John McCallum’s dataset (doesn’t load at time of writing, but is discussed in Sandberg and Bostrom 2008 and on our page on trends in the cost of computing)
- Passmark has a huge quantity of empirical performance data, for CPUs and GPUs. However it is all in terms of their own benchmark, so hard to compare to other things. They also list current prices. Looking at it over time (via archive.org) can let you also see past prices. Doing so suggests that they change their benchmarks on occasion, which makes it even harder to interpret what they mean.
- Geekbench Browser collects empirical performance data from people testing their computers with Geekbench’s service. They list many benchmark numbers for many computers. However identically named benchmark figures from ‘Geekbench v4’ vs. ‘Geekbench v3’ for the same hardware differ a lot (one of us recollects about a factor of five), apparently because they changed what the benchmark actually was then. This suggests care should be taken to use numbers from the same version of Geekbench, and also that any version is not necessarily comparable to other apparently identical measures from elsewhere. We are also not sure whether differences in benchmark meaning only occur between saliently labeled versions.
- Export compliance metrics for Intel Processors is a collection of PDFs listing processors alongside a number for ‘FLOP’, which we suppose is related to FLOPS. It does not contain much explanation, and has some worrying characteristics.1
- Karl Rupp has collected some data and made it available. He has also blogged about it here and here. However he says he got it from a combination of the Intel compliance metrics (listed above), and the list of Intel Xeon Microprocessors (below), and a) the export compliance metrics data seems strange, and b) we couldn’t actually track down his data in those sources. Possibly we are misunderstanding the export compliance metrics, and he is interpreting them correctly, resolving both problems.
- Asteroids@home lists Whetstone benchmark GFLOPS per core by CPU model for computers participating in their project.
- The Microway knowledge center has a lot of pages containing at least some theoretical peak performance numbers (see any called ‘detailed specifications of —‘, but most of the numbers on each page are inside figures, and so hard to export or read in detail.
Other useful hardware data
- List of Intel Xeon Microprocessors does not include figures for FLOPS, but has price and release date data.


1 Trackback / Pingback