This is an interactive timeline we made, illustrating the median dates when respondents said they expected a 10%, 50% and 90% chance of different tasks being automatable, in the 2016 Expert Survey on progress in AI (further details on that page).
AI Timelines
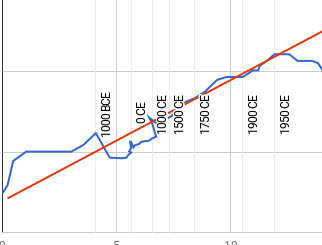
Historical economic growth trends
Clarifying concepts
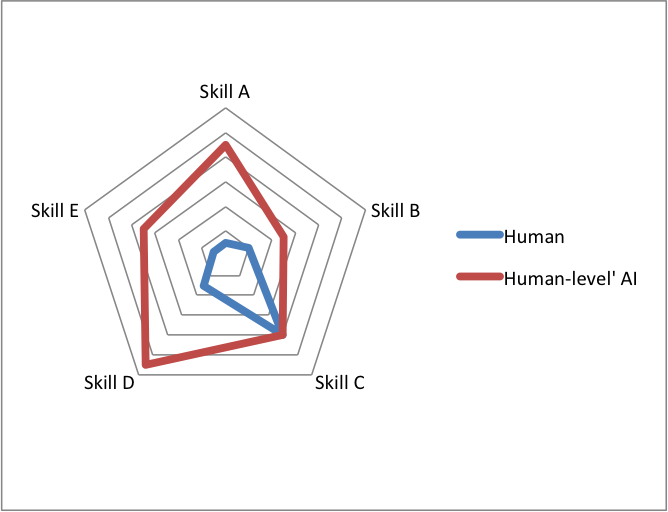
Human-Level AI

Research problems
Be the first to comment