From 2006 – 2020, Geekbench score per CPU price has grown by around 16% a year, for rates that would yield an order of magnitude over roughly 16 years.
Details
We looked at Geekbench 5,1 a benchmark for CPU performance. We combined Geekbench’s multi-core scores on its ‘Processor Benchmarks’ page2 with release dates and prices that we scraped from Wikichip and Wikipedia.3 All our data and plots can be found here.4 We then calculated score per dollar and adjusted for inflation using the consumer price index.5 For every year, we calculated the 95th percentile score per dollar. We then fit linear and exponential trendlines to those scores.
Figure 1 shows all our data for Geekbench score per CPU price.
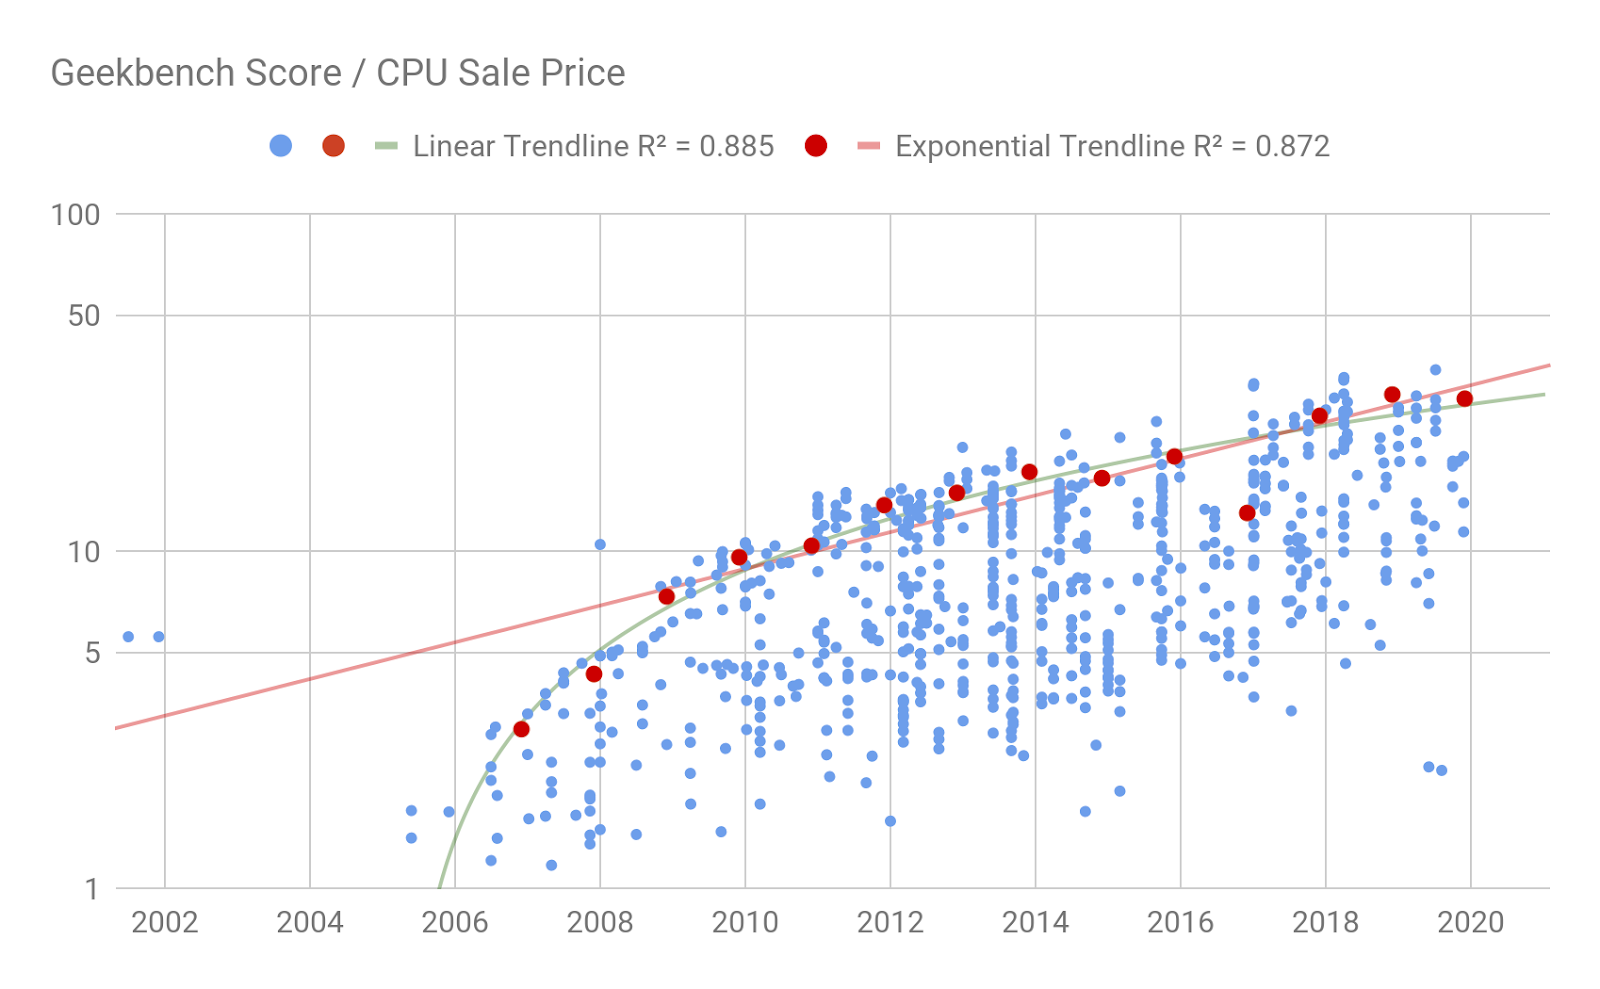
The data is well-described by a linear or an exponential trendline. Assuming an exponential trend,6 Geekbench score per CPU price grew by around 16% per year between 2006 and 2020, a rate that would yield a factor of ten every 16 years.7
This is a markedly slower growth rate than those observed for CPU price performance trends in the past, however since it is for a different performance metric to any used earlier, it is unclear how similar one should expect them to be– from 1940 to 2008, Sandberg and Bostrom found that CPU price performance grew by a factor of ten every 5.6 years when measured in MIPS per dollar, and by a factor of ten every 7.7 years when measured in FLOPS per dollar.8
Primary author: Asya Bergal
Notes
- “Introducing Geekbench 5.” Geekbench 5 – Cross-Platform Benchmark. Accessed April 2, 2020. https://www.geekbench.com/.
- “Processor Benchmarks.” Processor Benchmarks – Geekbench Browser. Accessed April 14, 2020. https://browser.geekbench.com/processor-benchmarks.
- Starting with Geekbench’s list of CPUs, we Googled ‘<CPU> Wikichip’ and ‘<CPU> Wikipedia’ to find lists of processor release dates and prices. We then copied Wikichip tables into this spreadsheet, tab ‘Wikichip / Wikipedia Information’, and used this script to parse CPU data from tables in individual Wikipedia pages before copying them into the same spreadsheet.
- The ‘Geekbench Scores’ tab lists all the Geekbench CPU scores, while ‘Wikichip / Wikipedia Information’ stores all our scraped release dates and prices.
- “CPI Home.” U.S. Bureau of Labor Statistics. U.S. Bureau of Labor Statistics. Accessed April 14, 2020. https://www.bls.gov/cpi/.
- Where ambiguous, we assume these trends are exponential rather than linear, because our understanding is that that is much more common historically in computing hardware price trends.
- See this spreadsheet, sheet ‘Geekbench Scores’ for our calculations, which are next to the cell marked ‘Exponential trendline from 2006 – now’.
- See our Trends in the cost of computing page, section ‘Sandberg and Bostrom’.