[This page is out of date and its contents may have been inaccurate in 2015, in light of new information that we are yet to integrate. See Computing capacity of all GPUs and TPUs for a related and more up-to-date analysis.]
Computing capacity worldwide was probably around 2 x 10²⁰ – 1.5 x 10²¹ FLOPS, at around the end of 2015.
Support
We are not aware of recent, plausible estimates for hardware capacity.
Vipul Naik estimated global hardware capacity in February 2014, based on Hilbert & Lopez’s estimates for 1986-2007. He calculated that if all computers ran at full capacity, they would perform 10-1000 zettaFLOPS, i.e. 1022 – 1024 FLOPS.1 We think these are substantial overestimates, because producing so much computing hardware would cost more than 10% of gross world product (GWP), which is implausibly high. The most cost-efficient computing hardware we are aware of today are GPUs, which still cost about $3/GFLOPS, or $1/GFLOPSyear if we assume hardware is used for around three years. This means maintaining hardware capable of 1022 – 1024 FLOPS would cost at least $1013 – $1015 per year. Yet gross world product (GWP) is only around $8 x 10¹³, so this would imply hardware spending constitutes more than 13% – 1300% of GWP. Even the lower end of this range seems implausible.2
One way to estimate global hardware capacity ourselves is based on annual hardware spending. This is slightly complicated because hardware lasts for several years. So to calculate how much hardware exists in 2016, we would ideally like to know how much was bought in every preceding year, and also how much of each annual hardware purchase has already been discarded. To simplify matters, we will instead assume that hardware lasts for around three years.
It appears that very roughly $300bn-$1,500bn was spent on hardware in 2015.3 We previously estimated that the cheapest available hardware (in April 2015) was around $3/GFLOPS. So if humanity spent $300bn-$1,500bn on hardware in 2015, and it was mostly the cheapest hardware, then the hardware we bought should perform around 1020 – 5 x 10²⁰ FLOPS. If we multiply this by three to account for the previous two years’ hardware purchases still being around, we have about 3 x 10²⁰ – 1.5 x 10²¹ FLOPS.
This estimate is rough, and could be improved in several ways. Most likely, more hardware is being bought each year than the previous year. So approximating last years’ hardware purchase to this years’ will yield too much hardware. In particular, the faster global hardware is growing, the closer the total is to whatever humanity bought this year (that is, counterintuitively, if you think hardware is growing faster, you should suppose that there is less of it by this particular method of estimation). Furthermore, perhaps a lot of hardware is not the cheapest for various reasons. This too suggests there is less hardware than we estimated.
On the other hand, hardware may often last for more than three years (we don’t have a strong basis for our assumption there). And our prices are from early 2015, so hardware is likely somewhat cheaper now (in early 2016). Our guess is that overall these considerations mean our estimate should be lower, but probably by less than a factor of four in total. This suggests 7.5 x 10¹⁹ – 1.5 x 10²¹ FLOPS of hardware.
However Hilbert & Lopez (2012) estimated that in 2007 the world’s computing capacity was around 2 x 10²⁰ IPS (similar to FLOPS) already, after constructing a detailed inventory of technologies.4 Their estimate does not appear to conflict with data about the global economy at the time.5 Growth is unlikely to have been negative since 2007, though Hilbert & Lopez may have overestimated. So we revise our estimate to 2 x 10²⁰ – 1.5 x 10²¹ FLOPS for the end of 2015.
This still suggests that in the last nine years, the world’s hardware has grown by a factor of 1-7.5, implying a growth rate of 0%-25%. Even 25% would be quite low compared to growth rates between 1986 and 2007 according to Hilbert & Lopez (2012), which were 61% for general purpose computing and 86% for the set of ASICs they studied (which in 2007 accounted for 32 times as much computing as general purpose computers).6 However if we are to distrust estimates which imply hardware is a large fraction of GWP, then we must expect hardware growth has slowed substantially in recent years. For comparison, our estimates are around 2-15% of Naik’s lower bound, and suggest that hardware constitutes around 0.3%-1.9% of GWP.
Such large changes in the long run growth rate are surprising to us, and—if they are real—we are unsure what produced them. One possibility is that hardware prices have stopped falling so fast (i.e. Moore’s Law is ending for the price of computation). Another is that spending on hardware decreased for some reason, for instance because people stopped enjoying large returns from additional hardware. We think this question deserves further research.
Implications
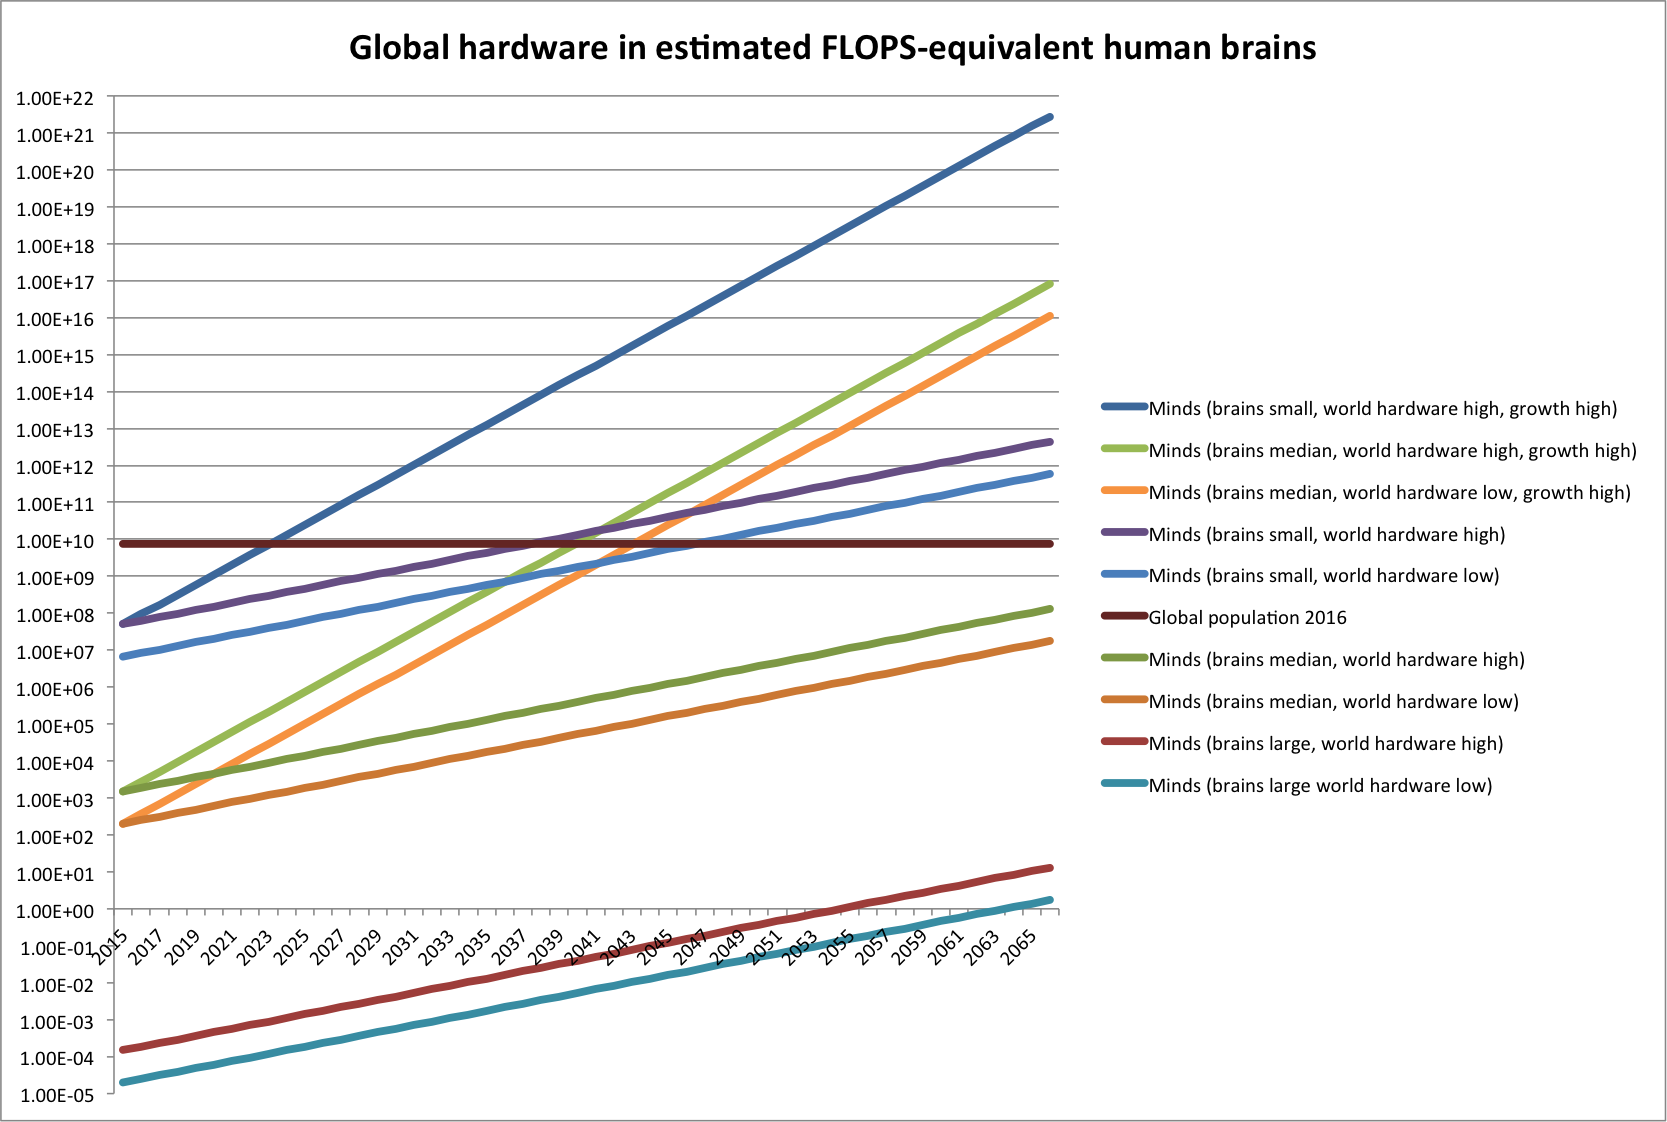
Global computing capacity in terms of human brains
According to different estimates, the human brain performs the equivalent of between 3 x 10¹³ and 1025 FLOPS. The median estimate we know of is 1018 FLOPS. According to that median estimate and our estimate of global computing hardware, if the world’s entire computing capacity could be directed at running minds around as efficient as those of humans, we would have the equivalent of 200-1500 extra human minds.7 That is, turning all of the world’s hardware into human-efficiency minds at present would increase the world’s population of minds by at most about 0.00002%. If we select the most favorable set of estimates for producing large numbers, turning all of the world’s computing hardware into minds as efficient as humans’ would produce around 50 million extra minds, increasing the world’s effective population by about 1%.8
- “My current guesstimate for total computation being done would be 0.1-10 zettaFLOPS and current estimate for how much computation can be done if all computers ran at full capacity would be 10-1000 zettaFLOPS (but this would entail prohibitive energy costs and not be sustainable).”
– Vipul Naik, research notes
- One might wonder if the total stock of hardware seems high because hardware lasts for much longer than three years. This probably does not account for it, because the growth rate is high enough that even if substantially older hardware persisted, it would make up a small share of total hardware. For instance in 2007 the world’s computing capacity (for the general purpose and application specific computers Hilbert & Lopez estimated) was only 2 x 10²⁰ IPS (similar to FLOPS), roughly 0.02%-2% of Naik’s estimate.
- “In 2012, the worldwide computing hardware spending is expected at 418 billion U.S. dollars.” – Statista
Statista’s figure of ‘Forecast hardware spendings worldwide from 2013 to 2019 (in billion U.S. dollars)’ reports a 2013 figure of $987bn, increasing to $1075bn in 2015. It is unclear why these spending forecasts differ so much from Statista’s reported 2012 spending.
Statista also reports a prediction of 2016 hardware revenue at $409bn Euro, which is around $447bn USD. It looks like the prediction was made in 2012. Note that revenue is not identical to spending, but is probably a reasonable proxy.
For 2009, Reuters reports a substantially lower revenue figure than Statista, suggesting Statista figures may be systematically high, e.g. by being relatively inclusive:
“The global computer hardware market had total revenue of $193.2 billion in 2009, representing a compound annual growth rate (CAGR) of 5.4% for the period spanning 2005-2009.” – Research and Markets press release, Reuters,
Statista‘s figure indicates revenue of 296 billion Euros, or around $320 billion USD in 2009 (this is the same figure as for 2007, which may be the only number you can see without a subscription—so while it may look like we made an error here, we do have the figure for the correct year). This is around 50% more than the Research and Markets press release.
From these figures we estimate that spending on hardware in 2015 was $300bn-$1,500bn
- “It is written from the perspective of the results of our recent inventory of 60 technological categories between 1986 and 2007 (measured in bits and MIPS [million-instructions-per-second])…”
“…The combined capacity of both groups of computers has grown from 730 tera-IPS in 1986 (73010^12 instructions per second), over 22.5 peta-IPS in 1993 (22.510^15 instructions per second), to 1.8 exa-IPS in 2000 (1.810^18 IPS), and 196 exa-IPS in 2007 (or roughly 210^20 instructions per second).”
– Hilbert & Lopez (2012)
- In 2007, GWP was probably about $66T (in 2007 dollars). According to Hilbert & Lopez, the world could then perform 2 x 10²⁰ IPS, which is 2 x 10¹⁴ MIPS. According to Muehlhauser & Rieber, hardware cost roughly $5 x 10⁻³/MIPS in 2007. Thus the total value of hardware would have been around $5 x 10⁻³/MIPS x 2 x 10¹⁴ MIPS = $1012 (a trillion dollars), or 1.5% of GWP.
- “The respective compound annual growth rates between 1986–2007 were 61% for general-purpose computations and 86% for application-specific computations, which is 10 and 14 times faster than global GDP during that period, respectively.”
Hilbert & Lopez (2012)
- 2 x 10²⁰ /1018 = 2 x 10²
- 1.5 x 10²¹ FLOPS of hardware divided by 3 x 10¹³ FLOPS/brain gives us 5 x 10⁷ minds.

I like your approach to bracketing a figure. One thing I tell my clients is that that figure arising from research and analysis only needs to be accurate enough to become actionable. In other words, if you ask “Why do I need to know the current global computing capacity, and what will I do based upon the answer” then you can estimate the accuracy needed.
It would be difficult but interesting to come at this figure based on network traffic and some other data. Cisco has some widely cited data, and there are other sources. It would be an indirect method, but would be interesting to compare the answers.
Thanks again for a nice analysis.
My guess is that the shift to smaller computers like laptops and tablets could help to explain some of the hardware slowdown.
I came up with a couple of other back-of-the-envelope estimates, which I hope will be useful to future people’s own estimates. I estimate the world had capability for roughly 15-30*10^18 FLOPS as at November 2021. We can estimate the contribution from personal computers to a reasonable order-of-magnitude level, at 12*10^18 FLOPS. For supercomputers, the performance of the top 500 is measured at 3*10^18 FLOPS, and we can add those numbers to get my lower estimate. But then we have to extrapolate to count all the computers in between. The supercomputer data says that the first 10, next 90, and next 900 supercomputers contribute roughly the same capability, while the 0.1-1*10^9th-largest computers, which I assume are laptops, contribute maybe three times that. So each factor-of-10 increase in the number of computers we consider contributes roughly 1-3*10^18 FLOPS, and we can multiply by 10 assuming 10^10 computers worldwide to get 10-30*10^18 FLOPS in total.
For personal computers, FLOPS mainly come from the graphics card. “Number of teraflops” seems to be a one-digit number (I saw one estimate of 2.5 teraflops for a laptop, i.e. roughly 0.6 operations per processor cycle for a 4GHz laptop, while a 2017 Xbox does 6 teraflops) – so call it 3*10^9 FLOPS per personal computer. There are almost 8 billion people in the world, and some might have several computers/phones while some might have none (although phones might give fewer FLOPS each), so estimate 4*10^9 computers. That gives us roughly 12*10^18 FLOPS from personal computers.
The Top500 is a list of the world’s largest supercomputers https://www.top500.org/lists/top500/list/2021/11/?page=1. It says the world’s top 500 largest supercomputers in November 2021 did 3*10^18 FLOPS at the LINPACK task. The top supercomputer did 0.44*10^18 FLOPS, and the sum of the top 10 computers was 1.1*10^18 FLOPS. The sum of the last 400 computers was maybe 0.9*10^18, so the 11-100th supercomputers did roughly 1*10*18 FLOPS. The average of the 101-500th computers is a bit less than half the capability of the 100th computer, so extending that pattern to the 501-1000th computer would give 1.3*10^18 FLOPS from the 101-1000th computers. If we round this (down) to 1*10^18 FLOPS for each factor of 10 increase in number of computers, and extend to 1 billion computers, we get 9*10^18 FLOPS. This underestimates the growth in FLOPS as number of computers increases, and it says that 0.9 billion personal computers should contribute 1*10^18 FLOPS when I estimated 3*10^18 FLOPS above. I’m willing to multiply by 3 to fix this, but this is the weakest step in my argument.
Hi Christopher, I have struggled with this question for a while so your answer is really appreciated – it appears to conflict with the article above if I understand correctly? why do you think this is, would love your insights, I’m researching this topic and would love to get in touch with you if you’re open to it?
Hi,
I haven’t really had time to absorb this. I’ve done some work in this area. I did an initial estimate based on personal computers, then in 2016 compared those early results with Hilbert and Lopez (2011). I haven’t done anything since then, other than to take a look at the cost per unit of computing power, based on information in Wikipedia
https://markbahner.typepad.com/random_thoughts/2016/02/recalculating-worldwide-computing-power.html –> My second look at global computing power.
https://markbahner.typepad.com/random_thoughts/2020/01/progress-on-a-corollary-of-moores-law.html –> Progress in cost per unit of computing power, based on Wikipedia data through approximately 2017.
I can be contacted by gmail with my with my last name and first name…all one word, no periods.