The price of a gigabyte of DRAM has fallen by about a factor of ten every 5 years from 1957 to 2020. Since 2010, the price has fallen much more slowly, at a rate that would yield an order of magnitude over roughly 14 years.
Details
Background
DRAM, “dynamic random-access memory”, is a type of semiconductor memory. It is used as the main memory in modern computers and graphic cards.1
Data
We found two sources for historic pricing of DRAM. One was a dataset of DRAM prices and sizes from 1957 to 2018 collected by technologist and retired Computer Science professor2 John C. McCallum.3 The other dataset was extracted from a graph generated by Objective Analysis,4 a group that sells “third-party independent market research and data” to investors in the semiconductor industry.5 We have not checked where their data comes from and don’t have evidence about whether they are a trustworthy source.
Figure 1 shows McCallum’s data.6
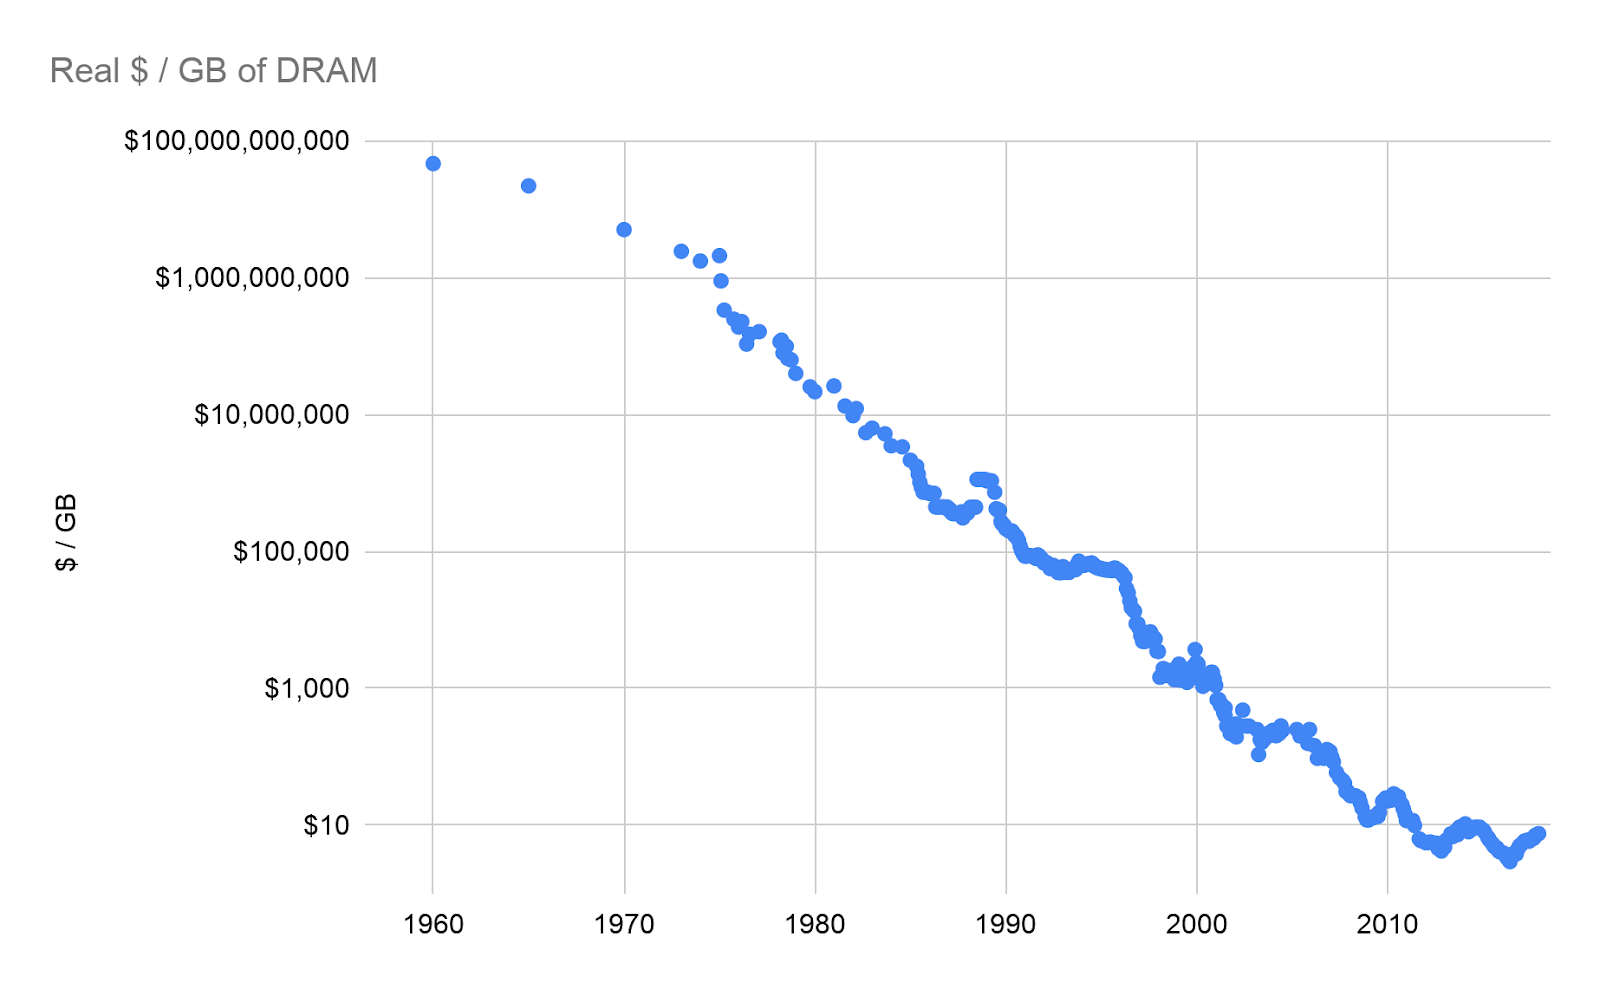
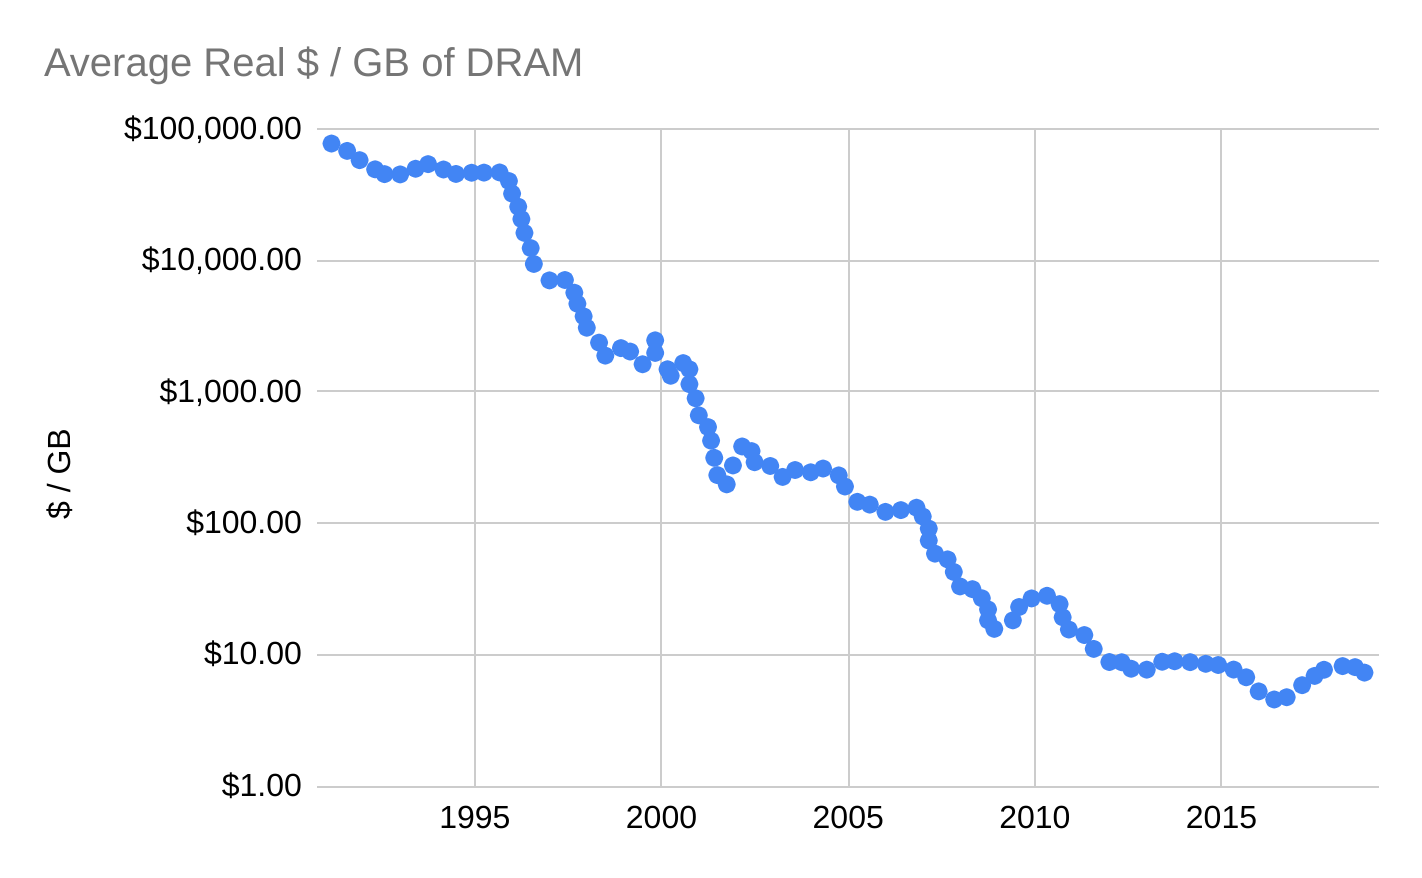
Figure 2 shows the average price per gigabyte of DRAM from 1991 to 2019, according to the Objective Analysis graph.8
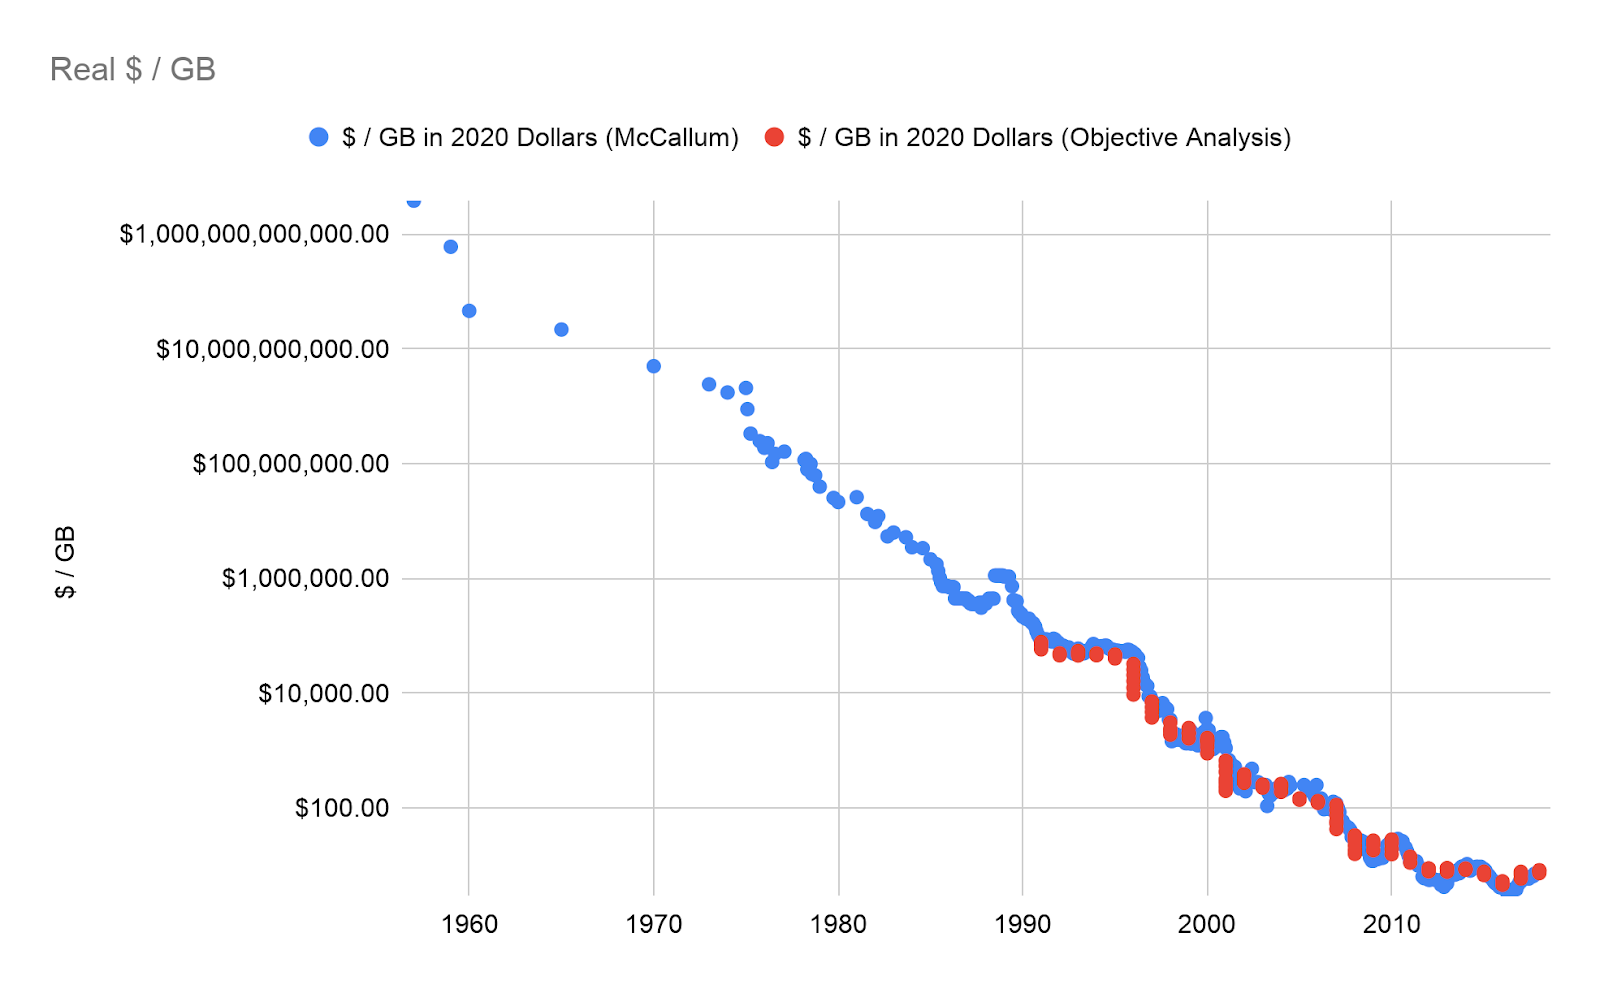
The two datasets appear to line up (see Figure 3 below),9 though we don’t know where the data in the Objective Analysis report came from– it could itself be referencing the McCallum dataset, or both could share data sources.
Analysis
For both sources, the data appears to follow an exponential trendline. In the McCallum dataset, we calculate that the price / GB of DRAM has fallen at around 36% per year, for a factor of ten every 5.1 years and a doubling time of 1.5 years on average. The Objective Analysis data is similar, with the price / GB of DRAM falling around 33% per year, for a factor of ten every 5.8 years and a doubling time of 1.7 years.
The 1.5 and 1.7 year doubling times are close to the rate at which Moore’s law observed that transistors in an integrated circuit double.10 It seems possible to us that cheaper and denser transistors following this law are what enabled the cheaper prices of DRAM, though we haven’t investigated this theory.11
Both datasets show slower progress in recent years. From 2010 onwards, the McCallum dataset falls in price by only 15% a year, for a rate that would yield a factor of ten every 14 years, and the Objective Analysis dataset falls by 12% a year, for a rate that would yield a factor of ten every 18.5 years.
Primary author: Asya Bergal
Notes
- From Wikipedia:
“Dynamic random-access memory (DRAM) is a type of random access semiconductor memory … One of the largest applications for DRAM is the main memory (colloquially called the “RAM”) in modern computers and graphics cards (where the “main memory” is called the graphics memory).”“Dynamic Random-Access Memory.” Wikipedia. Wikimedia Foundation, March 24, 2020. https://en.wikipedia.org/wiki/Dynamic_random-access_memory.
- From his personal website:
“1998-2001 Associate Professor, National University of Singapore, School of Computing – Computer Science”.“Biographical Information for Dr John C McCallum.” Biographical Information for Dr John C McCallum. Accessed April 14, 2020. http://jcmit.net/.
- “Historical Memory Prices 1957+.” Accessed April 9, 2020. https://jcmit.net/memoryprice.htm.
- We extracted data from the third graph in this blog post using the popular online tool WebPlotDigitizer to extract data. The graph is attributed to Objective Analysis, and appears to have been generated by the writer of the post, Jim Handy. (He explicitly says he generated previous graphs in the post.)
“DRAM Prices Hit Historic Low – The Memory Guy.” Accessed April 9, 2020. https://thememoryguy.com/dram-prices-hit-historic-low/. - See here for their website.
“Objective Analysis – Semiconductor Market Research.” Accessed April 9, 2020. https://objective-analysis.com/. - See this spreadsheet, tab ‘McCallum Data’, for a copy of the dataset and resulting graph production.
- “CPI Home.” U.S. Bureau of Labor Statistics. U.S. Bureau of Labor Statistics. Accessed April 23, 2020. https://www.bls.gov/cpi/.
- See this spreadsheet, tab ‘Objective Analysis Data’, for a copy of the dataset and resulting graph production.
- See the ‘Combined Data’ tab in this spreadsheet for graph generation.
- From Wikipedia:
“Moore’s law is the observation that the number of transistors in a dense integrated circuit doubles about every two years.”
“Moore’s Law.” Wikipedia. Wikimedia Foundation, April 8, 2020. https://en.wikipedia.org/w/index.php?title=Moore’s_law&oldid=949708131.
- Moore’s Law only refers to the number of transistors, but our impression is that people also sometimes refer to a Moore’s price performance law, which suggests that the cost per transistor falls at similar rates. From this post on Longbets:
“Moore’s Law, which has defined a doubling of price/performance/value produced by semi-conductors every 12 to 18 months since 1966, will continue to deliver its exponential benefits for at least another five decades, without stopping or slowing.”
Renan, Sheldon. “‘Moore’s Law, Which Has Defined a Doubling of Price/Performance/Value Produced by Semi-Conductors Every 12 to 18 Months since 1966, Will Continue to Deliver Its Exponential Benefits for at Least Another Five Decades, without Stopping or Slowing.”.” Long Bets. Accessed April 10, 2020. http://longbets.org/70/