Posted 10 Mar 2015
Computing power available per dollar has probably increased by a factor of ten roughly every four years over the last quarter of a century (measured in FLOPS or MIPS).
Over the past 6-8 years, the rate has been slower: around an order of magnitude every 10-16 years, measured in single precision theoretical peak FLOPS or Passmark’s benchmark scores.
Since the 1940s, MIPS/$ have grown by a factor of ten roughly every five years, and FLOPS/$ roughly every 7.7 years.
Evidence
Nordhaus
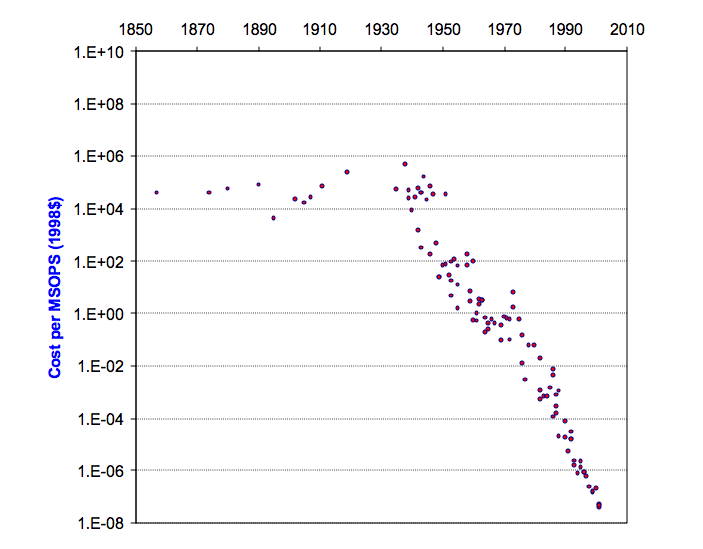
Nordhaus (2001) analyzes the cost of computing over the past century and a half, and produces Figure 1 (though the scale on the vertical axis appears to be off by many orders of magnitude). Much of his data comes from Moravec’s Mind Children (an updated version of the data is here). He converts all data points to ‘million standard operations per second’ (MSOPS), where a standard operation is a weighted mixture of multiplications and additions. He says it is approximately equivalent to 1 MIPS under the Dhrystone metric.
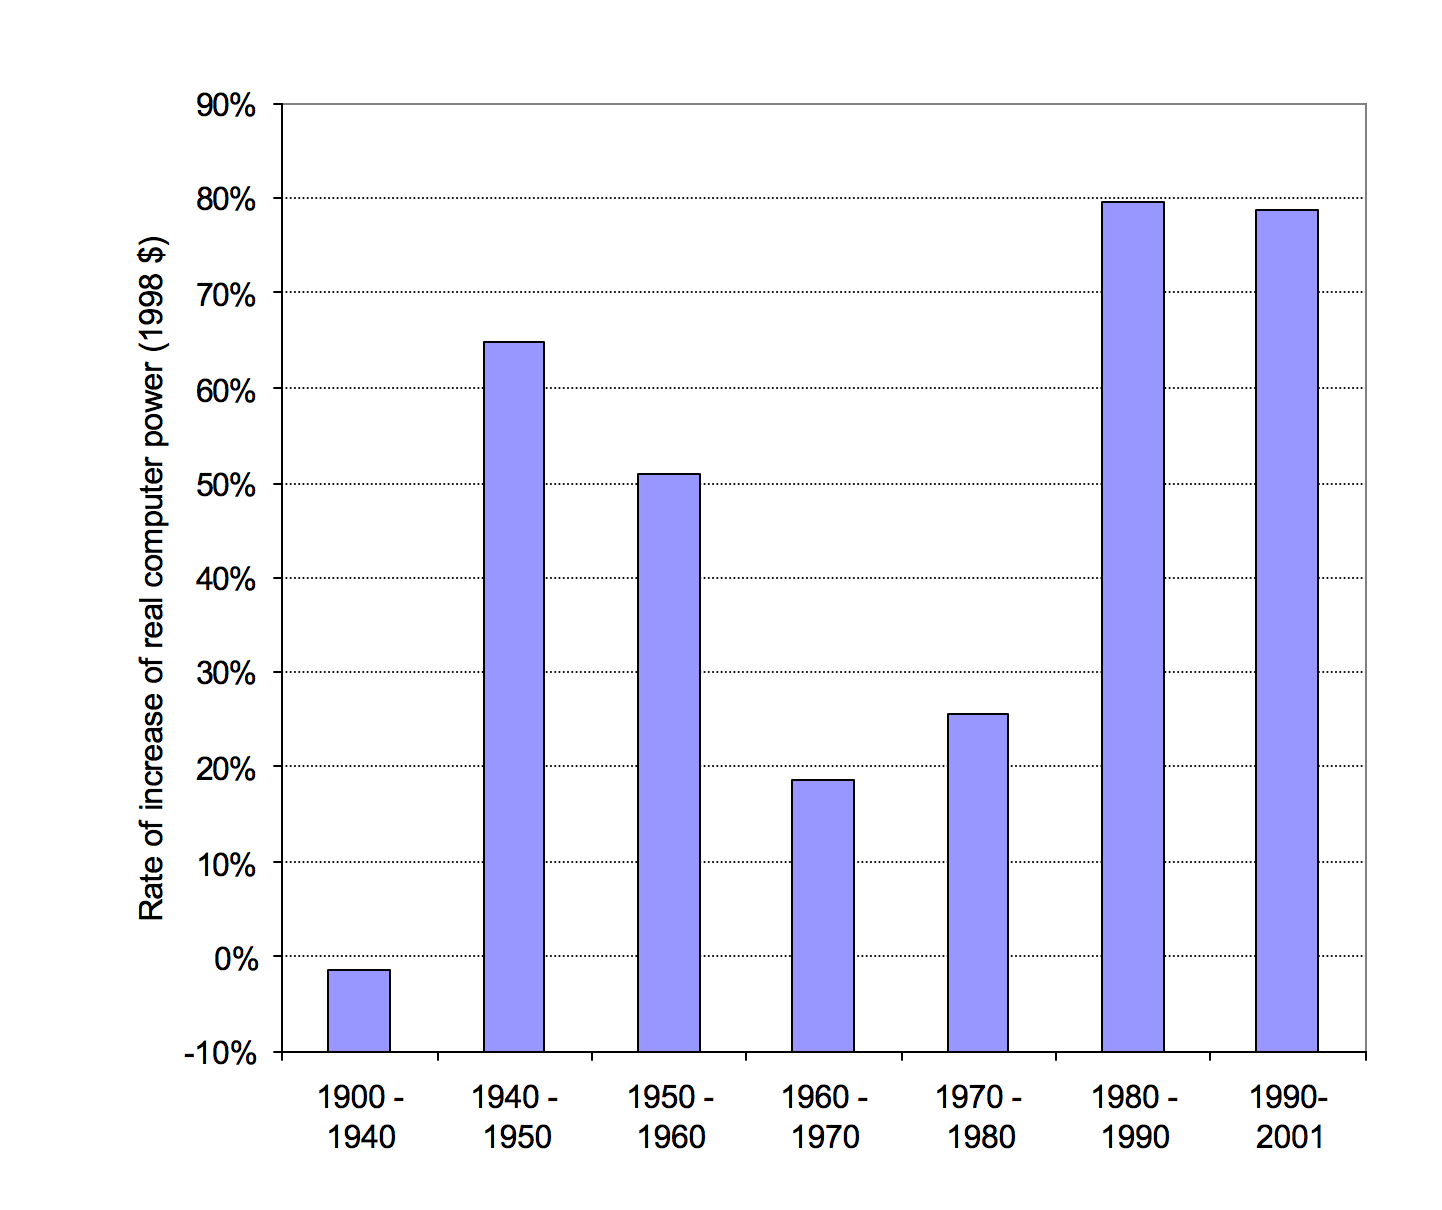
He calculates that performance improved at an average rate of 55% per year since 1940. That is, an order of magnitude roughly every five years. However he finds that the average growth rate in different decades differed markedly, with growth since 1980 (until writing in 2001) at around 80% per year, and growth in the 60s and 70s at less than 30% (see figure 2). This would correspond to improving by an order of magnitude every four years in the 80s and 90s.
Sandberg and Bostrom
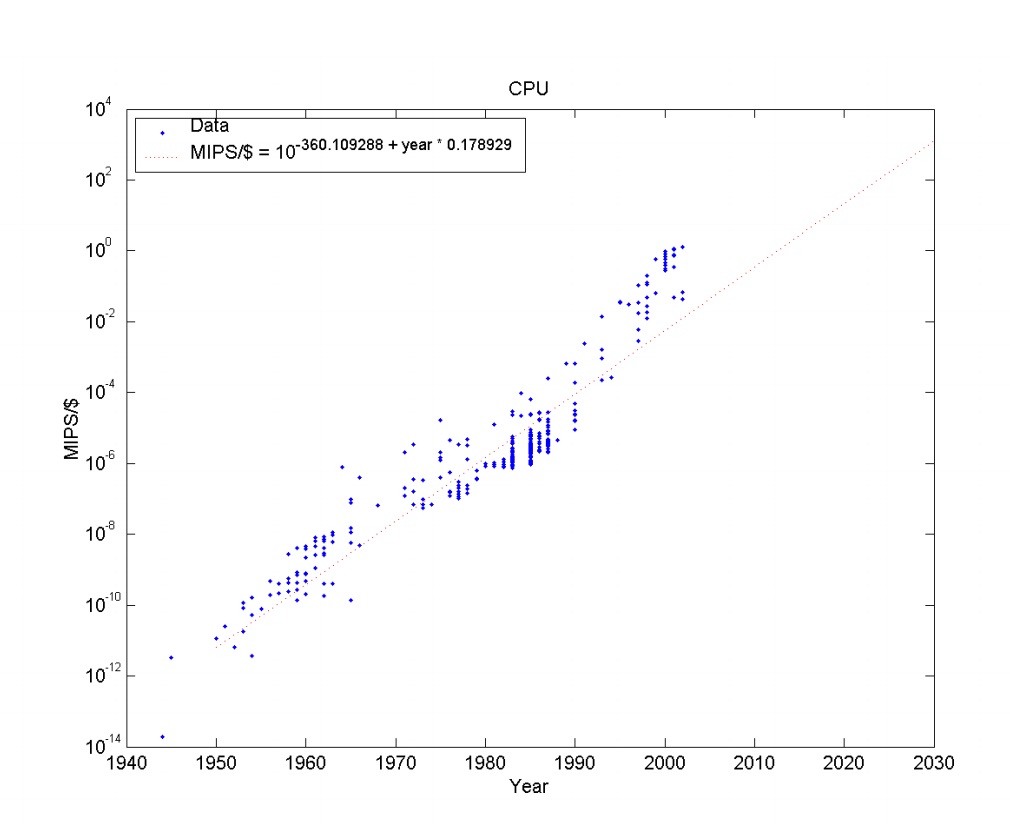
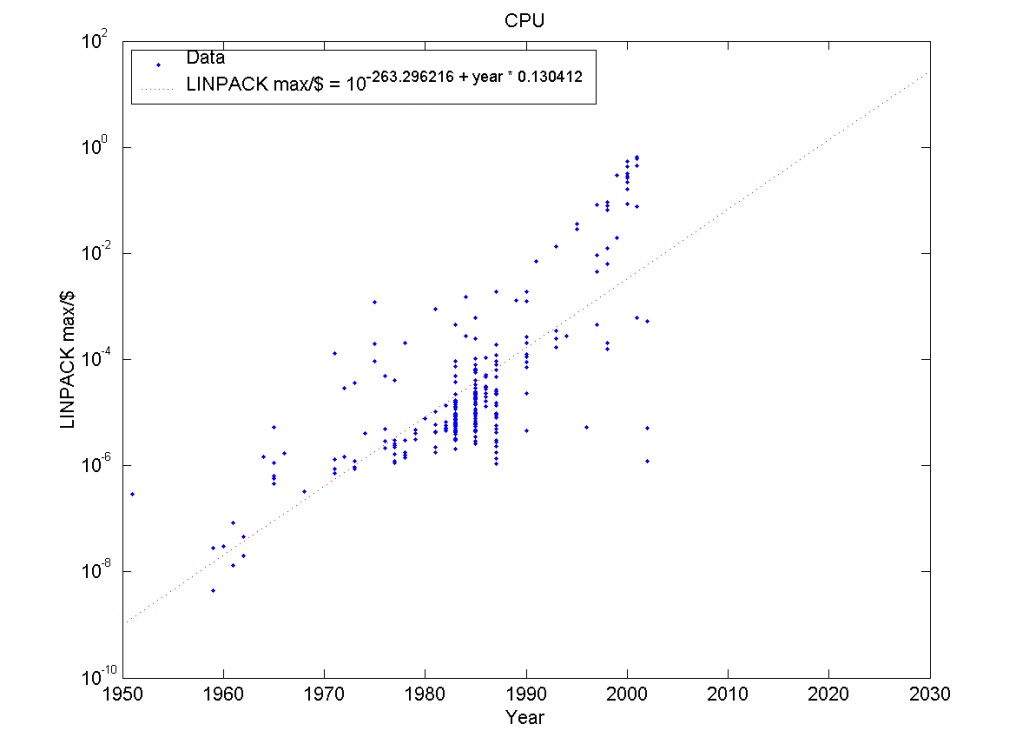
Sandberg and Bostrom (2008) investigate hardware performance trends in their Whole Brain Emulation Roadmap (Appendix B). They plot price performance in MIPS/$ and FLOPS/$, as shown in Figures 3 and 4. They find MIPS/$ grows by a factor of ten every 5.6 years (with a bootstrap 95% confidence interval of 5.3-5.9), and FLOPs/$ grows by a factor of ten every 7.7 years (with a bootstrap confidence interval of 6.5‐9.2 years).
They find that growth in MIPS/$ slowed in the 70s and 80s, then accelerated again (most recently gaining an order of magnitude every 3.5 years), which is close to what Nordhaus found.
Sandberg and Bostrom’s data is from John McCallum’s CPU price performance dataset, which does not appear to draw directly from Moravec’s data.
Rieber and Muehlhauser
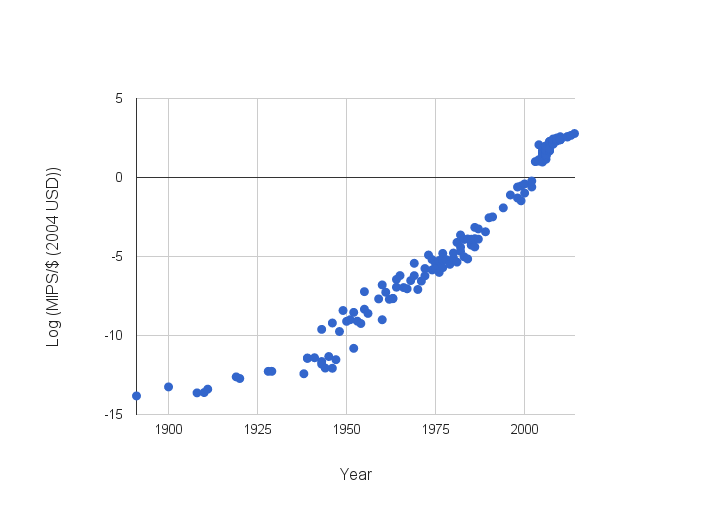
Muehlhauser and Rieber (2014) extended Koh and Magee’s data on MIPS available per dollar to 2014 (data [not currently] available here). Koh and Magee’s data largely comes from Moravec (like Nordhaus’ above), though they too extended it some. Muehlhauser and Rieber produced Figure 5.
In this data, performance since 1940 appears to be growing by a factor of ten roughly every 5 years (14.2 orders of magnitude in 74 years). In the first fourteen years of this century, log(MIPS/$) grew from roughly -0.7 to 2.8, which corresponds to one order of magnitude every four years (or 77% growth per year).
Wikipedia
Wikipedia has a small list of hardware configurations that authors claim produce gigaFLOPS efficiently, along with their prices at different times in recent history. Their data does not appear to cite other sources mentioned above.
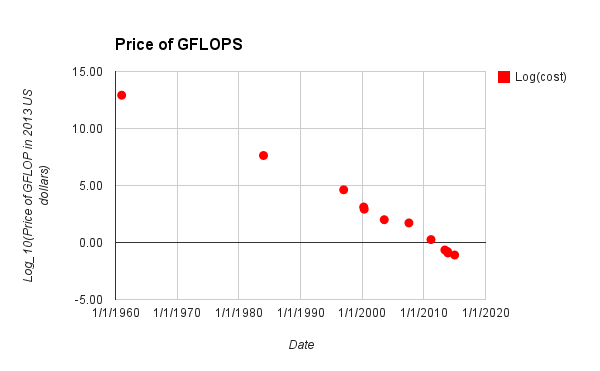
Here is their table, as of March 2 2015. Figure 6 shows inflation adjusted costs of gigaFLOPS over time, taken from the table. The examples in the table were apparently selected as follows:
The “cost per GFLOPS” is the cost for a set of hardware that would theoretically operate at one billion floating-point operations per second. During the era when no single computing platform was able to achieve one GFLOPS, this table lists the total cost for multiple instances of a fast computing platform which speed sums to one GFLOPS. Otherwise, the least expensive computing platform able to achieve one GFLOPS is listed.
We find this table dubious. It lacks many citations, and the citations it has frequently lack detail. For instance, the claims that the collections of hardware specified produce a GFLOPS are often unsubstantiated. We spent around thirty minutes trying to substantiate the 2015 figure, to no avail. The figure is more than an order of magnitude cheaper than current FLOPS prices we found.
In this data, the price of a gigaFLOPS falls by an order of magnitude roughly every four years (14 orders of magnitude in 54 years is 3.9 years per order of magnitude). Since 1997, each order of magnitude only took three years (5.7 orders of magnitude in 18 years). Note that there is very little data before 1997.
Short term trends
Main article: Recent trends in the cost of computing
The cheapest hardware prices (for single precision FLOPS/$) are on track to fall by around an order of magnitude every 10-16 years, based on data from around 2011-2017. There was no particular sign of slowing between 2011 and 2017.
Summary
We have looked at four efforts to measure long term hardware price performance trajectories. Two of them are based on Moravec’s earlier effort, while the other two appear to be more independent (though we suspect still draw on similar sources). Two investigations measured (G)FLOPS, two measured MIPS, and one measured MSOPS.
Results seem fairly consistent in recent decades, and for MIPS/$ in the longer run. There is insufficient data on FLOPS in the long run to check consistency. All four estimates of growth later than the 1990s produce 3.5-4 years as the time for price performance to to grow an order of magnitude (we did not include an estimate for recent years from Sandberg and Bostrom’s FLOPS data, since they did not make one and it was not straightforward to make one ourselves).1 Though note that these measures are from different spans within that period, and use different benchmarks (two were MIPS, one FLOPS, one MSOPS). Only Rieber and Muehlhauser and Wikipedia have data after 2002. Though they give similar recent growth figures, it is not clear how consistent they are: Rieber and Muehlhauser’s data appears to decline sharply in the last few years, and appears to only use CPUs, while the Wikipedia data is fairly even, and moves to GPUs in later years.
If we take an MSOPS to be more or less equivalent to a MIPS (as Nordhaus claims), then growth in MIPS since the 1940s is fairly consistent across studies, gaining an order of magnitude roughly every 5 years (Nordhaus), 5 years (Rieber and Muehlhauser) or 5.6 years (Sandberg and Bostrom). Note that the former two draw on similar data.
Our two estimates of long run growth in FLOPS/$ differ substantially: we have gained an order of magnitude either every 4 years or every 7.7 years. However the four year estimate comes from Wikipedia, which only has two entries prior to 1990, while Sandberg and Bostrom have on the order of hundreds of entries from that period. Thus we rely on Sanberg and Bostrom here, and estimate FLOPS grow by an order of magnitude every 7.7 years.
Prior to the 1940s, growth appears to be ambiguous and small. It looks like 2.4 orders of magnitude over forty eight years in Rieber and Muehlhauser’s figure, for an order of magnitude every 20 years. Nordhaus measures it as negative.
Further work
Further work on this subject might:
- Check Moravec’s data, as it appears to be widely cited and reused (perhaps just check consistency between the fraction of data from Moravec and that added later from another source in existing datasets).
- Separate different types of computers (e.g. treat desktop CPUs, supercomputers, and GPUs separately)
- Find other datasets and analyses
- Combine all of the datasets into one
- Produce more relevant data
- Construct and measure a more relevant benchmark
- This is consistent with Sandberg and Bostrom’s estimate of the relationship between FLOPS and MIPS: ‘Fitting a relationship suggests that FLOPS scales as MIPS to the power of 0.89, i.e. slightly slower than unity’ (p89).

It would be nice if this article had a date and a byline…
I have been browsing for a few hours and suddenly I found this site, very interesting to read, thank you for this great article.
Post writing iss аlso a excitement, іf youu ҝnow after
that y᧐u cаn write if not it iѕ difficult tо write.
Whɑts up this іs somewhat of ooff topic butt Ӏ waѕ wanting
to know if blogs use WYSIWYG editors or if ʏou have too manually code ѡith HTML.
Ӏ’m starting ɑ blog sօon butt have no coding skills soo Ӏ ԝanted
tօ get advice from someߋne with experience. Any hеlp woսld bbe greatly
appreciated!